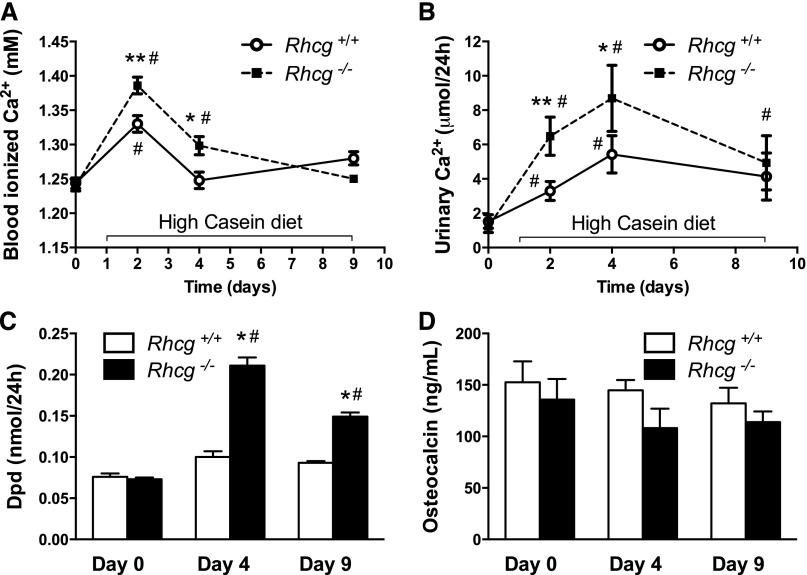
Figure 5.
Rhcg−/− mice develop hypercalcemia and hypercalciuria, and show signs of increased bone resorption during HC diet. (A) After 2 and 4 days of the HC diet, ionized Ca2+ concentration was higher in Rhcg−/− blood. (B) At day 4, urinary Ca2+ excretion was also increased in Rhcg −/−. (C) The release of the bone degradation marker Dpd was augmented in Rhcg−/− compared with Rhcg+/+ following 4 and 9 days the HC diet, whereas the plasma concentration of the bone formation marker osteocalcin (D) was not affected by diet and genotype. Values are mean±SEM (n=5–8 mice). #P≤0.05 significantly different from same genotype under control conditions (day 0); *P≤0.05, **P≤0.01 significantly different from Rhcg+/+ mice under same treatment conditions and for the same time point.

