Figure 6.
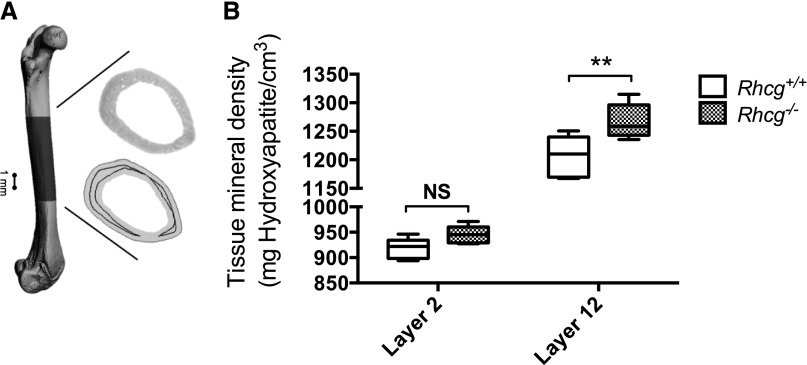
HC diet reduces bone mineral density in Rhcg−/− mice. (A) Micro-CT reconstruction of a femur with the midcortical region considered for TMD evaluation. The inset shows the different gray values (top), which carry information on TMD and a cross-section (bottom) with layer 2 close to the periosteum (light gray) and layer 12 (dark gray). (B) TMD of Rhcg−/− was higher than TMD of Rhcg+/+ in the diet-independent layer 12 but not in layer 2, which was formed during the diet. Data are represented by boxplots (i.e., the inner box contains 50% of all data, the whisker bars denote the full range, and the black line represents the median value [over all animals]). Statistical significance was obtained with two-way ANOVA with Bonferroni multiple comparisons test; n=5 per genotype. **P≤0.01 significantly different from wild-type mice under same treatment conditions and for the same time point.

