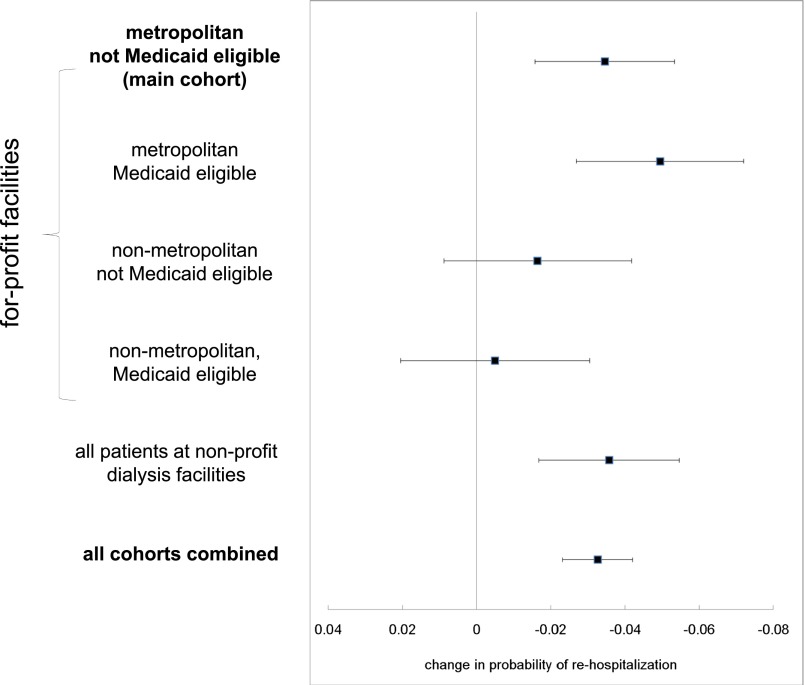
Figure 3.
Estimated change in probability of rehospitalization from one additional visit in different patient cohorts. A test for heterogeneity between visit frequency estimates based on the Q-statistic from a meta-analysis was unable to reject the hypothesis that the mean was the same (P=0.07).36 Error bars represent 95% confidence intervals for the estimated changes in probability of rehospitalization.

