Figure 1.
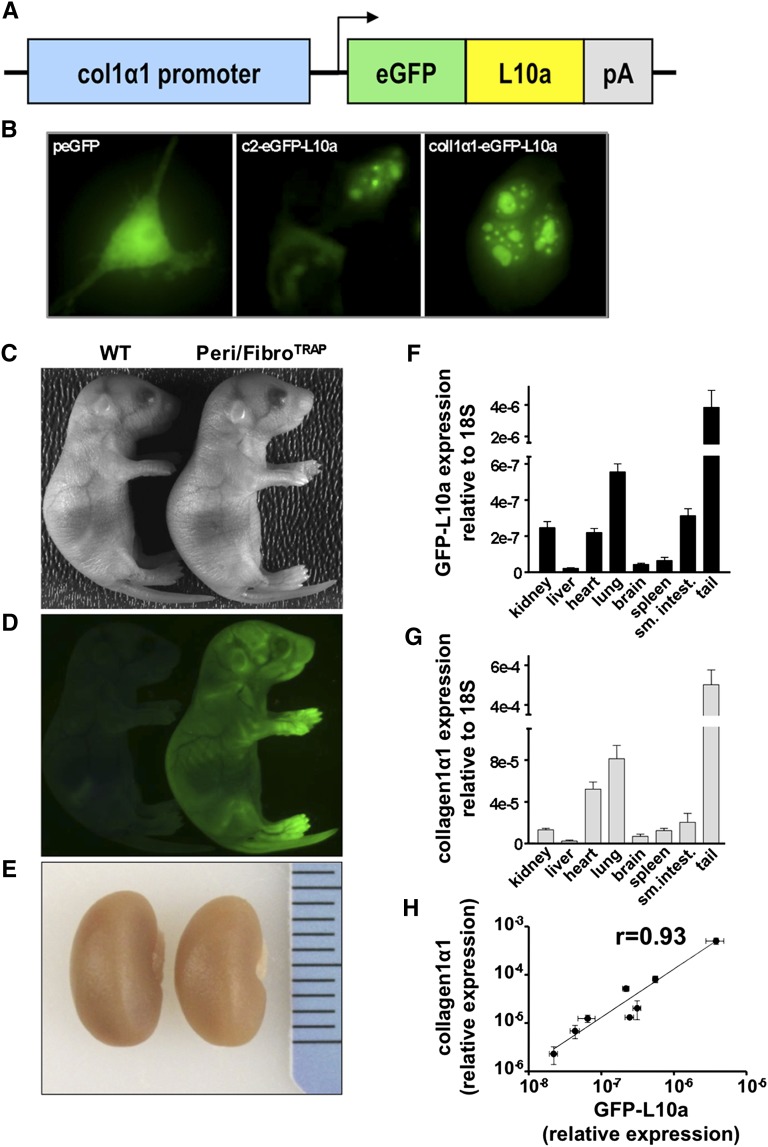
The Col1a1-eGFP-L10a transgenic mouse faithfully recapitulates endogenous COL1α1 expression. (A) Transgene structure. A cDNA encoding the eGFP-L10a fusion protein was inserted downstream of the col1α1 promoter/enhancer element. (B) 3T3 cells were transiently transfected with peGFP (control), c2-eGFP-L10a (positive control), or the col1α1-eGFP-L10a plasmid. C2-eGFP-L10a (middle) and col1α1-eGFP-L10a (right) transfected cells show the expected ribosomal localization pattern (nucleoli, perinuclear region). eGFP (left) transfected cells show a homogenously distributed fluorescence throughout the cell body. (C–E) Positive founders (right) exhibit prominent green fluorescence reflecting eGFP-L10a expression in skin fibroblasts. Gross kidney morphology is indistinguishable between mice. (F and G) qPCR comparison of eGFP-L10a and endogenous col1α1 expression in Peri/FibroTRAP animals. Expression levels of eGFP-L10a and endogenous col1α1 transcripts show similar patterns across various organs. Mean±SEM, n=4 for each data point. (H) Robust positive correlation between eGFP-L10a and native col1α1 expression. Data points reflect mean relative expression values±SEM of eGFP-L10a and col1α1 mRNA expression.

