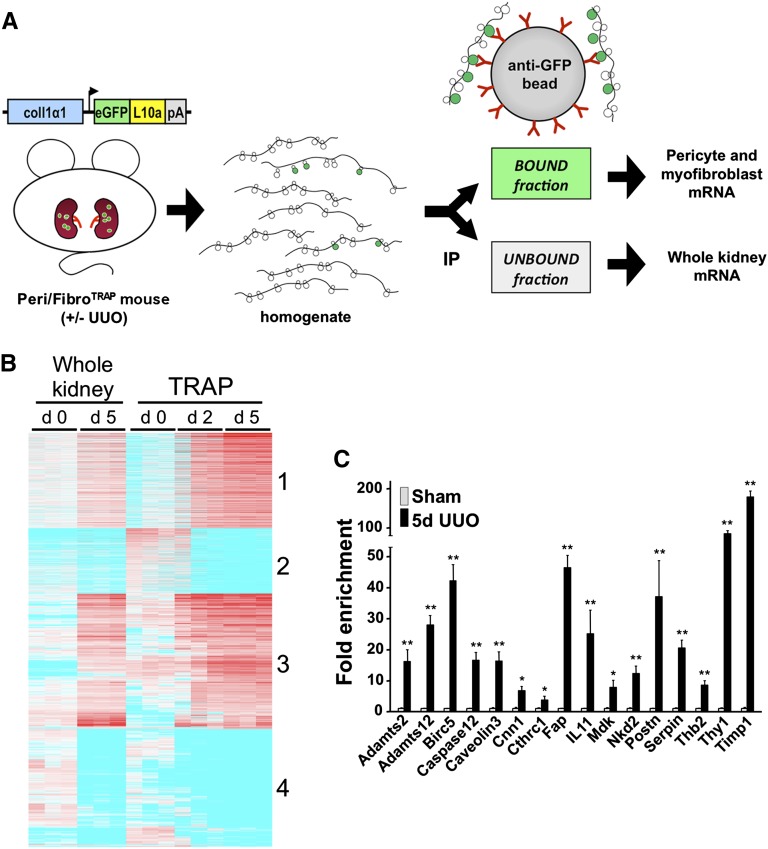
Figure 4.
Microarray analysis of TRAP-isolated RNA and candidate validation by qPCR in experimental fibrosis. (A) Schematic illustrating the principles and workflow of TRAP. Kidney medulla from Peri/FibroTRAP mice is harvested, immediately homogenized, and immunoprecipitated (IP) with anti-GFP–coated magnetic beads. Polysomes containing the tagged ribosomal protein eGFP-L10a bind to the beads, thus representing the pericyte-specific mRNA fraction; the unbound fraction represents the whole medulla. The mRNA is isolated and processed for downstream analysis. (B) Heat map of microarray results (Affymetrix Mouse Genome 430 2.0 chips) showing differential gene expression in bound, pericyte/myofibroblast-specific mRNA fractions extracted from sham, UUO day 2 and UUO day 5 kidneys from Peri/FibroTRAP mice. Unbound RNA, which reflects total kidney medulla, is also shown between sham and UUO day 5. Note clustering into 4 distinct groups. (C) Expression of 16 candidate genes identified as upregulated by TRAP was validated by qPCR of whole kidney RNA samples. Data are shown as mean±SEM, n=4 for each data point; *P<0.05; **P<0.01.

