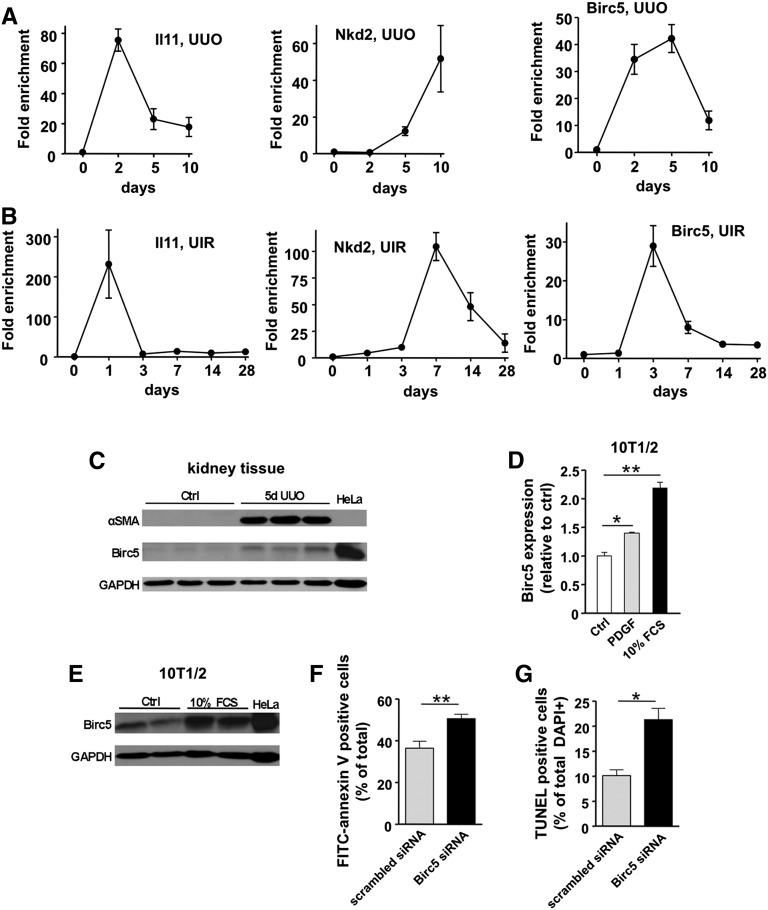
Figure 6.
Differential expression kinetics of genes identified by TRAP in two fibrosis models and functional validation of Birc5 as a potential target. (A) Time course analysis of IL11, Nkd2, and Birc5 (survivin) expression during UUO. (B) Expression of the same genes was analyzed in a second fibrotic model, unilateral ischemia-reperfusion (UIR). Note similar expression patterns. Mean±SEM, n=3–5 for each time point. (C) Analysis of renal Birc5 protein expression during UUO. Note concomitant induction of myofibroblast marker αSMA. HeLa cell lysate was used as positive control for Birc5. (D) In vitro stimulation of pericyte-like 10T1/2 cells with PDGF (20 ng/ml) or FCS (10%) for 24 hours causes a significant increase in Birc5 expression. Mean±SEM, n=3 for each data point; *P<0.01; **P<0.001. (E) Birc5 protein is also increased in 10T1/2 cells upon stimulation with 10% FCS compared to unstimulated control (Ctrl). (F) Analysis of cell apoptosis by FITC-annexin V staining of 10T1/2 cells. Knockdown of Birc5 by siRNA results in significant increase of apoptotic rate compared with scrambled siRNA-transfected control cells. Serum starvation was used to induce apoptosis. Mean±SEM, n=13–17 for each data point. (G) Analysis of TUNEL labeling confirms enhanced cell apoptosis upon siRNA mediated knockdown of Birc5. Mean±SEM, n=3–4; *P<0.01; **P<0.001. GAPDH, glyceraldehyde 3-phosphate dehydrogenase.

