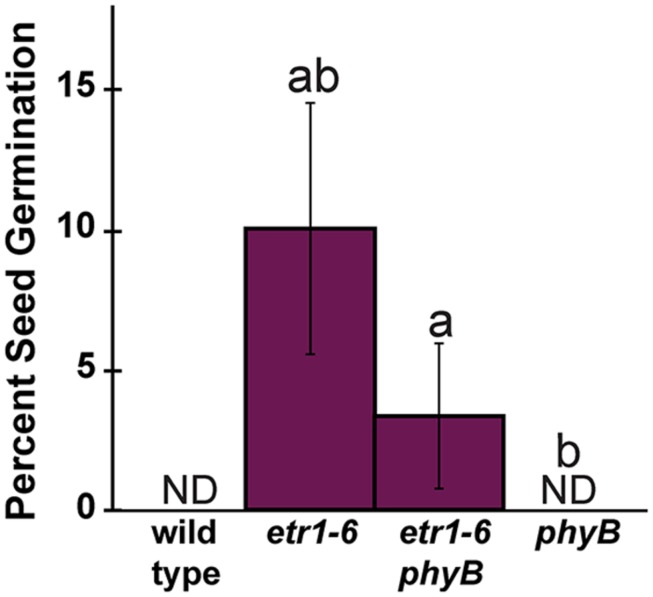
FIGURE 9.
Epistasis analysis of ETR1 and PHYB in the dark. Seeds were germinated in the dark for 7 days and the percent of seed germination was then determined. The average ± SD from at least three biological replicates is plotted. ND denotes no germination detected. The data were analyzed by t-tests and differences considered statistically significant with P < 0.05. aStatistical difference from wild-type in that light condition; bSignificant difference of the single mutant from the double mutant.

