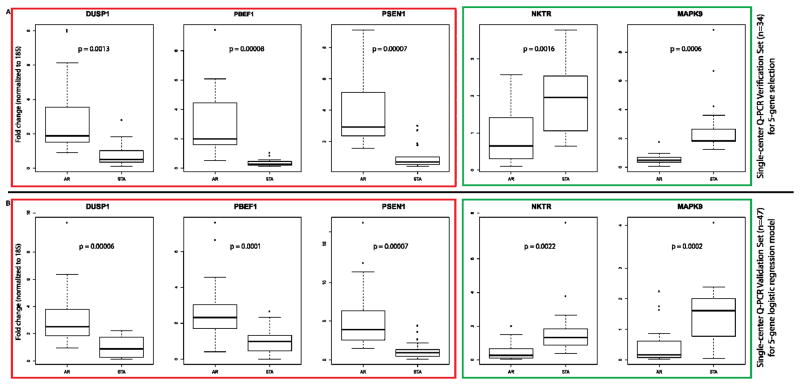
Figure 2. Single–center Verification and Validation of Gene Expression for the 5-Gene Set.
Box plots of the QPCR gene expression values are shown for the selected 5 genes: DUSP1, PBEF1 And PSEN1 are upregulated in AR (red outline); NKTR and MAPK9 are downregulated in AR (green outline) in the single center Verification Set (n=34; Figure 2A) and in the single center independent Training Set 1 (n=47; Figure 2B), for building the logistic regression model on the 5 gene-set. We applied logistic regression with best subset selection to the Verification Set in order to find the minimum number of genes necessary for the proper classification of biopsy-confirmed AR. Chi-square score for logistic regression models built using these 10 genes showed that increase in the score was minimal when more than five genes were used in the model. Chi-square score for logistic regression models built using all 10 genes showed that the increase in Chi-square score from a model with 1 gene to 3 genes is 7.70; from a model with 3 genes to 5 genes is 1.87; and from a model with 5 genes to a model with 6 is only an increase of 0.48. Hence, the logistic regression model using a set of 5 genes was selected based on the best performing 5-genes set (Chi-square score = 29.63) as DUSP1, PBEF1, PSEN1, MAPK9, and NKTR. The p values for comparison of gene expression data for each gene are shown in each dataset and each value is significant (p<0.05).

