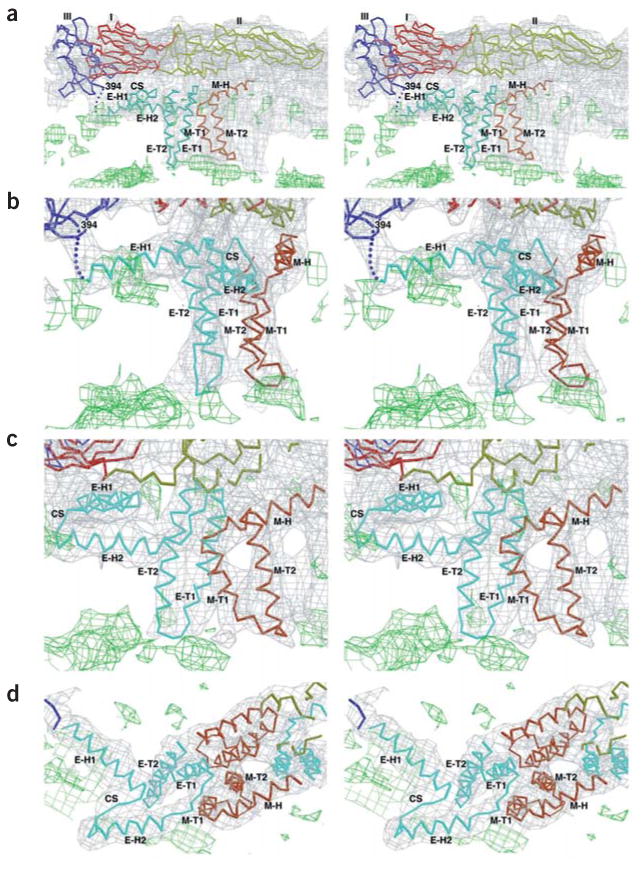
Figure 3.

Stereoscopic diagrams showing the fit of the Cα backbones for the E and M regions into the cryo-EM density (gray) of the outer lipid (green) leaflet associated with the E dimer on the icosahedral two-fold axis. E ectodomains I, II and III are red, yellow and blue, respectively; stem-anchor region of E, cyan; M protein, orange; cryoEM density of the lipid bilayers, green. The stem and transmembrane helices are labeled with the nomenclature shown in Figure 2. Contour levels are chosen arbitrarily. The contour level for the lipid (green) is lower than that for the protein (gray). (a) Side view showing E and M monomers. (b) Enlarged view of a with a +50° rotation about the vertical axis to more clearly show the fit of E-H1 into the density. (c) Enlarged view of a with a –20° rotation about the vertical axis to more clearly show the fit of E-H2 and M-H into the density. (d) Top view of helices E-H1, E-H2 and M-H.
