
Figure 4. Influence of bevacizumab, nintedanib and their combination on tumor growth, microvessel density and mTORC1 activity in bevacizumab-resistant xenografts.
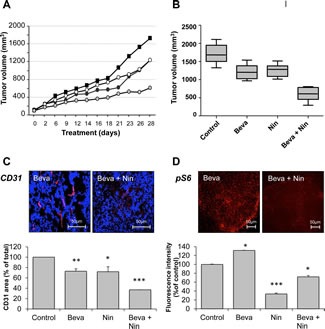
Nude mice with HT-29 human CRC xenografts were dosed with vehicle (Control), bevacizumab at 5 mg/kg i.p. every 3 days (Beva), nintedanib at 12,5 mg/kg p.o. once daily (Nin 12,5) or with a combination of bevacizumab and nintedanib for 4 weeks. Each treatment group corresponded to at least seven animals. (A) Average tumor growth of HT-29 tumorgrafts in mice treated with vehicle (black squares), bevacizumab (black circles), nintedanib (white circles) or their combination (light grey circles). (B) Box and whisker plot of the tumor volumes of HT-29 xenografts after 4 weeks treatment with bevacizumab, nintedanib or their combination. Lines, medians; boxes, 25th to 75th percentile interquartile ranges; whiskers, the highest and lowest values for a given treatment. The expression of CD31 (C) and pS6 (D) was determined by immunohistochemistry followed by quantitative image analysis. The photos illustrate typical staining patterns for tumors derived from animals treated with bevacizumab or with a combination of bevacizumab plus nintedanib. For the quantitative analysis of the signal intensity, the data represent the average fluorescence intensity of treated tumors compared to the treatment intensity of control tumors and are the averages of 6 fields/tumor for at least 3 different tumors. The statistical analysis of experimental data was performed using a Student's paired t-test comparing the treatment group with the vehicle control. Bars, SD; * p < 0,05; ** p < 0,01; *** p < 0,001.