Figure 4.
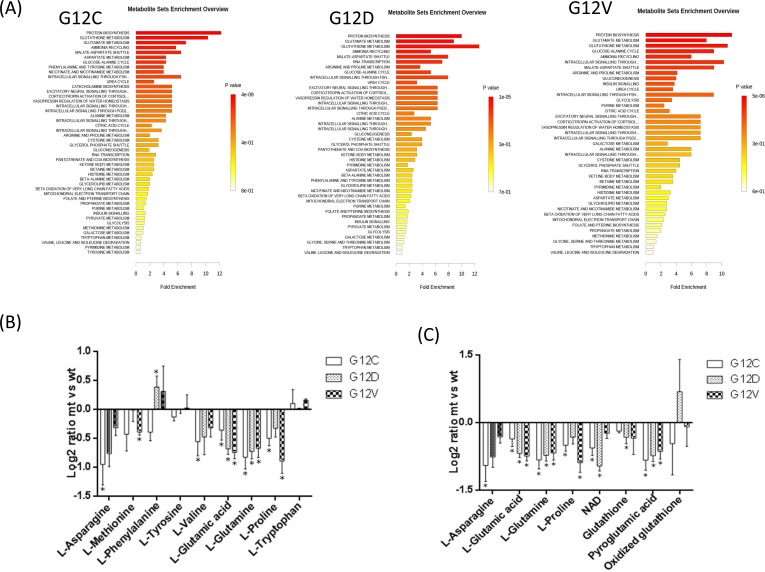
Metabolic pathway analyses related to the metabolites that specifically differ in KRAS mutant clones G12C, G12D, G12V and KRAS WT, utilizing the MetaboAnalyst functional interpretation tools. Panel A, graphic summary of metabolite set enrichment analysis for each KRAS mutational status. The horizontal bars summarize the main metabolite sets identified in this analysis; the bars are colored based on their p-values and the length is based on the -fold enrichment. Panel B shows the difference in abundance (as log2ratio intensity between mutant and WT) of the metabolite subset mapped into the first top-score enrichment category (protein synthesis). Panel C shows the difference in abundance (as log2ratio intensity between mutant and WT) of the metabolite subset mapped into three interconnected pathways categories (glutamate, glutathione metabolism, ammonia recycling). Grey bars represent the difference in metabolite abundance not significantly contributing to distinguish between KRAS mutants and WT by OPLS-DA multivariate analysis. Bars are mean SEM of the log2 ratio mt/wt of metabolite signal intensity. Asterisks mark significant differences (T-test, p<0.05) in metabolite intensities between mutant and WT clones.

