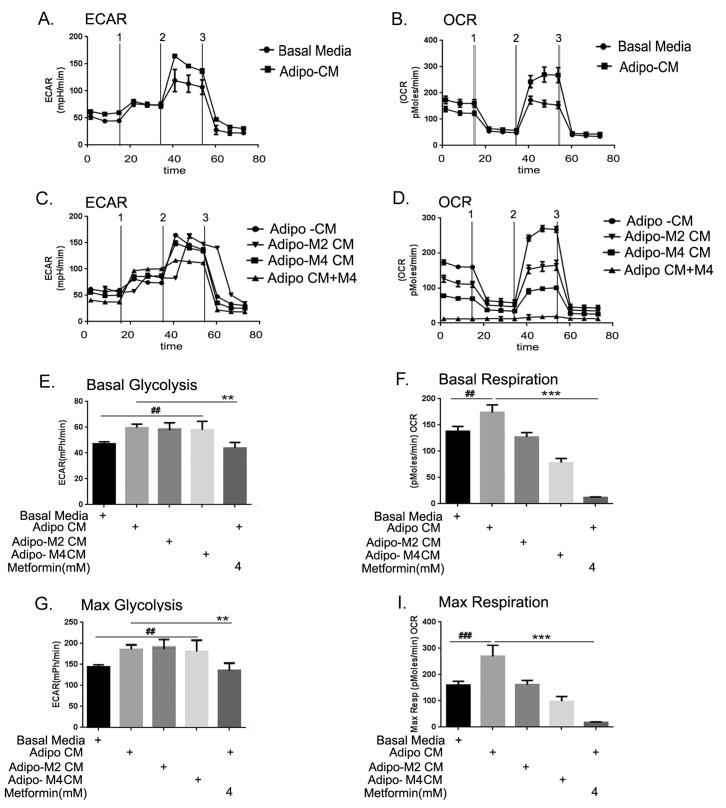
FIGURE 8. Adipocytes altered the cellular bioenergetics of the cancer cell.
(A) Extracellular acidification rate (ECAR) was measured as described in the Methods when challenged by (1) glucose, (2) oligomycin (an adenosine triphosphatase synthase blocker) and (3) 2-Deoxyglucose (an inhibitor of glycolysis). (B) Oxygen consumption rate (OCR) was measured as described in the Methods by a cell mitochondrial stress test when challenged by (1) oligomycin, (2) carbonylcyanide-p-trifluoromethoxyphenyl hydrazone (FCCP) (an electron transport chain uncoupler) and (3) rotenone/antimycin (an inhibitor of electron transport chain). (C) ECAR was measured in ID8 cells exposed to conditioned media from adipocytes differentiated in presence of metformin 2 or 4 Mm (adipo M2 CM or adipo M4 CM) and treated with metformin in presence of adipo CM. (D) OCR was measured in ID8 cells exposed to adipo M2 and M4 CM and treated with metformin in presence of adipo CM. (E) Basal glycolysis, is displayed as average of the first 3 resting state readings (##p < 0.01 compared to basal media; **p < 0.001 compared to adipo CM). (G) Maximum glycolytic capacity was calculated by normalizing at the oligomycin injections (##p < 0.01 compared to basal media; **p < 0.001 compared to adipo CM). (F) Basal respiration was taken as average of the first 3 resting state readings (##p < 0.01 compared to basal media; ***p < 0.001, compared to adipo CM). (H) Maximum respiration capacity was calculated by normalizing at the FCCP injections (###p < 0.001 compared to basal media; ***p < 0.001, compared to adipo CM).

