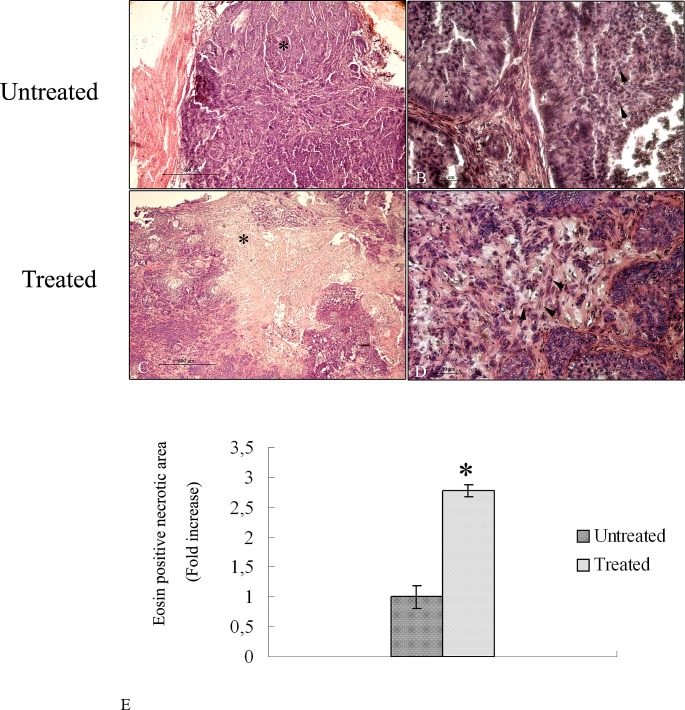
Figure 2. Hematoxylin and eosin stained histopathalogical sections of 4HPR-HSA untreated and treated tumors.
(A) Low magnification of tumor tissue treated with PBS. A large area of tumor cells is detectable (*) (bar: 600 um). (B) High magnification of tumor tissues treated with PBS. Cells with large nuclei and spherical or spindle shape were observed (arrowhead) (bar: 100 nm). (C) low magnification of 4HPR-HAS treated tumors. A large stained area of dead cells is detectable (*) (bar: 600 um). (C) High magnification of eosin stained area in which several dead cells are observed (arrowhead) (bar: 100 nm). All the results were repeated at least three times. (E) Quantitative analysis of eosin stained area in treated tumors expressed as relative amount compared to eosin necrotic area of untreated tumors (± SD) were assessed by direct visual counting of three fields for each of five slides per each sample at ×10 magnification by Image–ProPlus software. Data are the mean ± SD of three different consistent experiments.

