
Figure 4. TUNEL assay apoptosis of 4HPR-HSA tumor tissue.
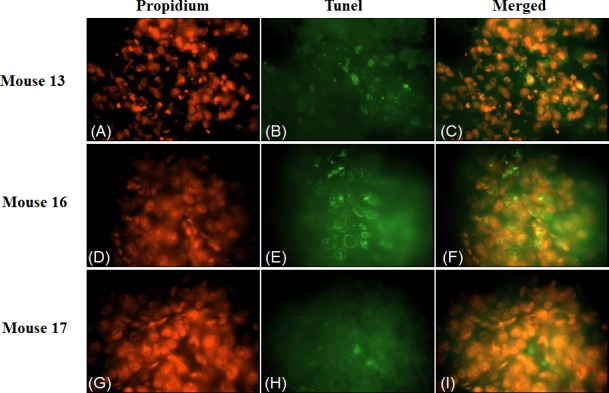
The images are representative for sections obtained from three different mouse of the 4HPR-HAS treated group. (A) (D) (G) Propidium stained nuclei. (B) (E) (H) TUNEL positive cells representative for apoptotic cells. (C) (F) (I) Merge images of the first and second column. All the images are 600X. All the results were repeated at least three times.