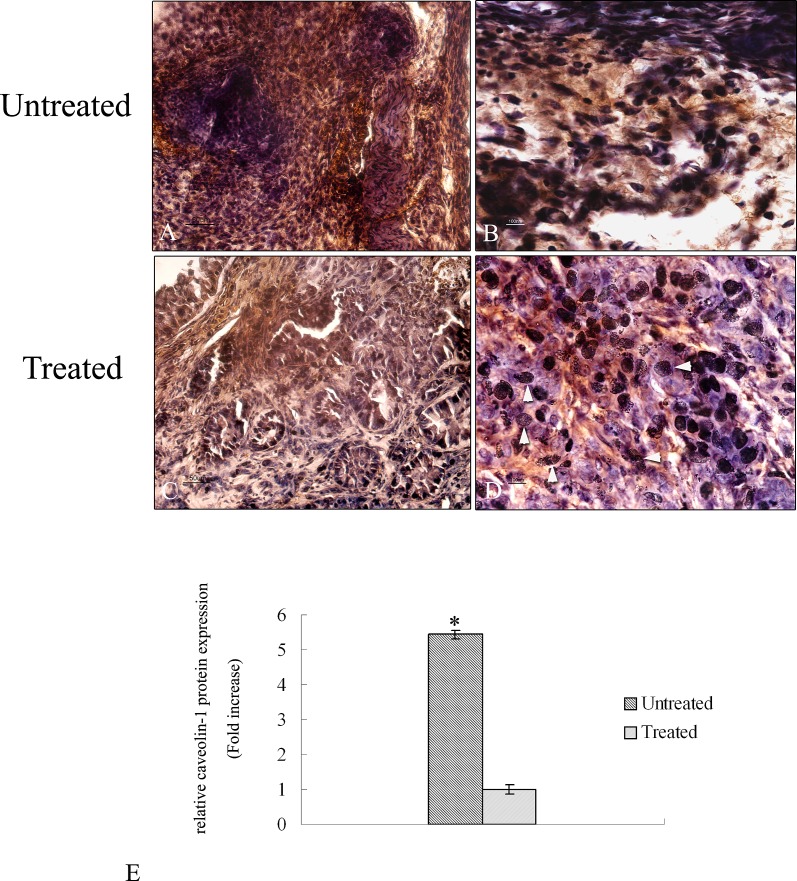
Figure 6. Immunohistochemical analysis of caveolin −1 protein in tumor sections.
A-D Paraffin – embedded tissues sections were stained with caveolin – 1 antibody and counterstained with hematoxylin. (A) Low magnification (20X) of tumor sections treated with PBS. A high signal corresponding to caveolin – 1 protein is detectable (bar: 50um). (B) High magnification (60X) of tumor sections treated with PBS. Caveolin – 1 signal is mainly localized in the cytoplasm of the cells (bar: 100 nm). (C) Low magnification (20X) of tumor sections treated with 4HPR-HSA. A low signal corresponding to caveolin – 1 protein is detectable (bar: 50um). (D) High magnification (60X) of tumor sections treated with 4HPR-HAS. A few cells showed a cytoplasmic signal corresponding to caveolin – 1 protein. Several damage nuclei were detected (arrowhead) (bar: 100 nm). All the results were repeated at least three times. Quantitative analysis of caveolin-1-positive area expressed as relative amount of treated samples (± SD) compared to untreated ones.

