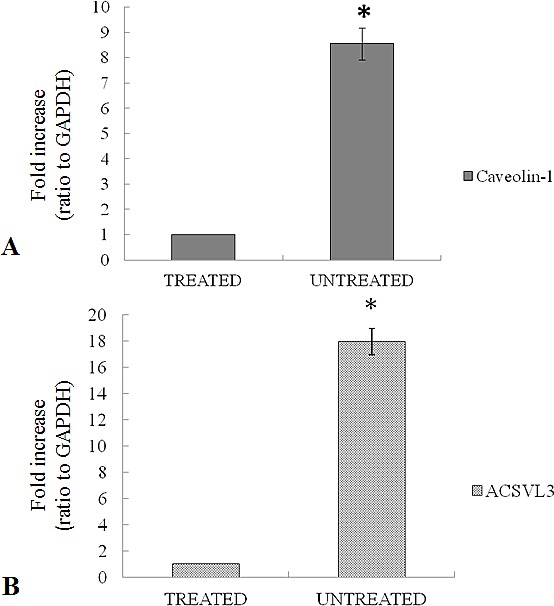
Figure 8.

(A) Expression of caveolin-1 mRNA in untreated tumors compared to treated tumors. (B) Expression of acsvl3 mRNA in untreated tumors compared to treated tumors. Each individual assay was performed in triplicates and expressed as mean ± SD; * represents a significant difference of untreated tumors compared to treated tumors, p< 0.05.
