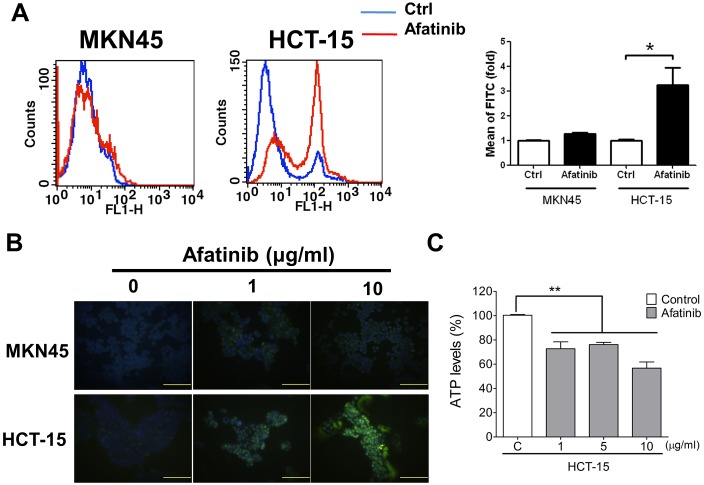
Figure 3. Afatinib causes cell apoptosis and mitochondrial toxicity in HER2-overexpressed CRC cells.
Cell apoptosis were determined by flow cytometric assay (AnnexinV and Propidium Iodide staining) (A) or TUNEL assay (B) in MKN45 and HCT-15 cells treated with afatinib (A, 10 μg/ml; B, 1 and 10 μg/ml) for 24 h. In A, data are presented as means ± SEM (n = 5). *P< 0.05, versus control. In B, the total nuclei were stained with 4’, 6-diamino-2-phenylindole (DAPI). Magnification: 400×, scale bar: 50 μm. (C) Mitochondrial dysfunction assay in afatinib-treated MKN45 and HCT-15 cells. Cells were treated with afatinib (1-10 μg/ml) for 24 h. Data are presented as means ± SEM (n = 5). **P< 0.01, versus control.

