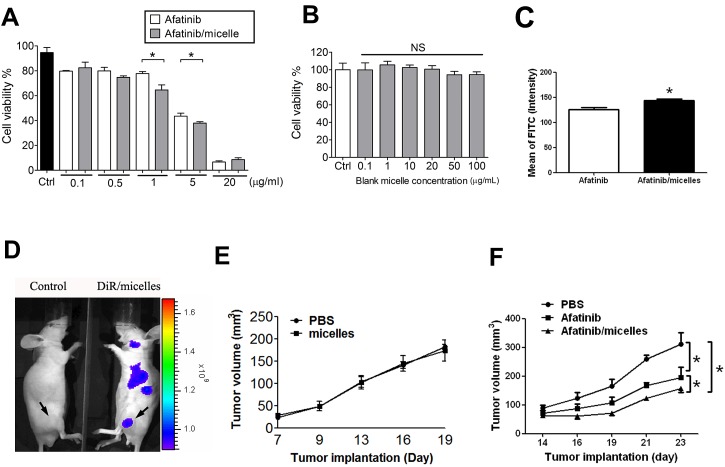
Figure 7. Afatinib/micelles increase the therapeutic efficacy of afatinib on CRC models.
(A-B) Cell viability was measured using WST-8 assay. HCT-15 cells were treated with afatinib or afatinib/micelles (0.1-20 μg/ml) (A) and blank micelle (0.1-100 μg/ml) (B) for 24 hrs. Data were presented as means ± SEM (n ≥ 5). *P< 0.05, versus afatinib. NS, Non-significant. (C) HCT-15 was treated with 10 μg/ml of afatinib or afatinib/micelles for 24 h, and then cells were stained AnnexinV and Propidium Iodide staining for apoptosis assay. (D) The distribution imaging of micelles in HCT-15-induced xenografts. In order to ensure the accumulative effect of micelles in tumors, the DiR/micelles were produced and injected into HCT-15-induced xenograft mice for 24 hrs. Then, the In vivo imaging system (IVIS) was performed to capture the imaging for detecting micelles distribution. (E) The effects of micelles alone on HCT-15-induced xenografts. Tumor volume was calculated by the formula: tumor volume [mm3] = (length [mm]) × (width [mm])2. All data are presented as means ± SEM (n = 5). (F) The therapeutic efficacy of PBS, afatinib alone, and afatinib/micelles in the HCT-15 xenograft model. Tumor volume was calculated by the formula: tumor volume [mm3] = (length [mm]) × (width [mm])2. All data are presented as means ± SEM (n = 5). *P < 0.05, versus afatinib.

