
Figure 9. Mitochondrial membrane depolarization induced by HNA.
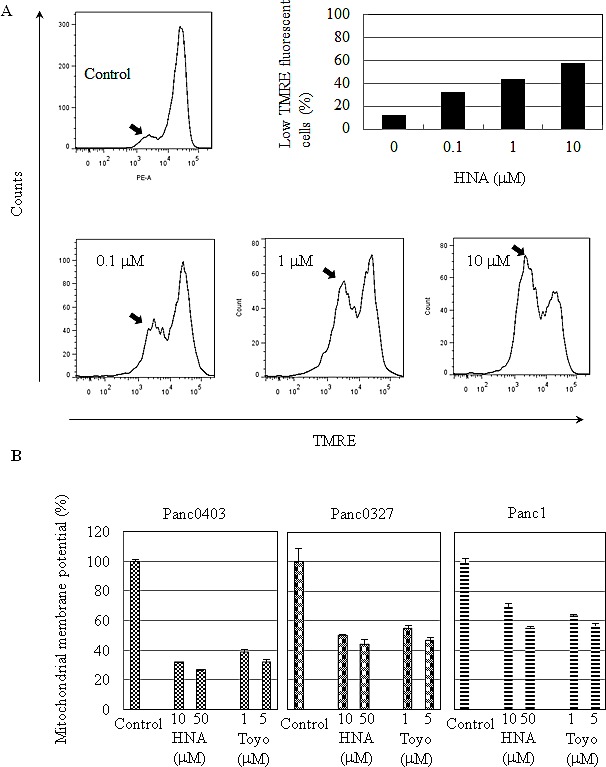
(A) Panc0403 pancreatic cancer cells were treated with HNA at 0.1, 1, 10 uM for 24 hr, and mitochondrial membrane potential was analysed by TMRE (tetramethyrhodamine ethyl ester percholarte) fluorescence. Histograms show the amount of TMRE sequestered by mitochondrial membrane. Low TMRE fluorescence (arrow) indicates decreased membrane potential. From the histogram, the portion of cells with low TMRE fluorescence (membrane potential) is summarized in the bar graph. (B) Three pancreatic cancer cell lines (Panc1, Panc0327, Panc0403) were treated with either HNA or toyocamycin at different concentrations for 24 hr and uptake of TMRE fluorescence by the cells was detected by a fluorescent plate reader. Each sample was run in duplicate, and the data represent the mean ± SD of two separate assays.