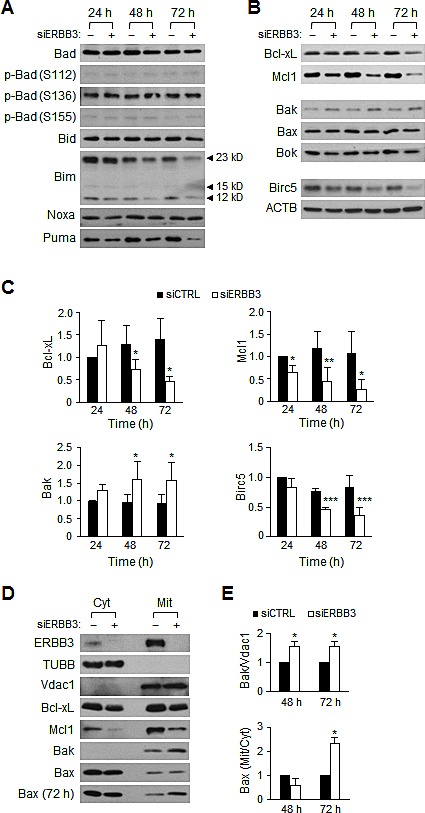
Figure 2. The time course changes in Bcl-2 family proteins levels after ERBB3 knockdown in HCT116 cells.

Western blotting was performed using protein extracts prepared daily after the treatment with 5 nM of siCTRL (–) or siERBB3 (+). Shown are representative (A) BH3-only proteins and (B) anti- or pro-apoptotic proteins, respectively. (C) The relative intensity of proteins in B compared to ACTB was normalized to that of siCTRL at 24 h. (D) Western blotting was performed using cytosol (Cyt) or membrane/organelle (Mit) fractions prepared 48 h after siRNA (5 nM) transfection. Bax (72 h) indicates blot using fractions prepared 72 h after transfection. TUBB and Vdac1 antibodies were used for the control of the Cyt and Mit fractions, respectively. (E) The relative band intensities of the mitochondrial Bak to Vdac1 (top), as well as the mitochondrial Bax to the cytosolic Bax (bottom), were normalized to the siCTRL group at each time point. siERBB3 group was statistically compared to siCTRL group at each point.
