
Figure 4. Effect of ERBB3 knockdown on cell proliferation, cell cycles and apoptosis in HCT116-p53 cells.
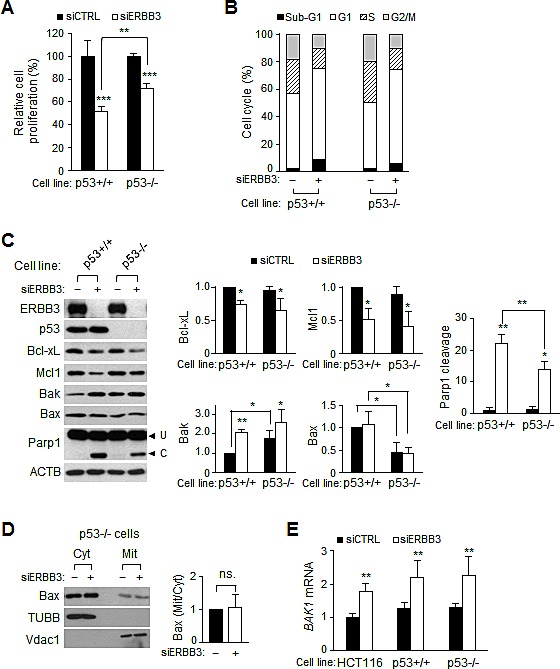
Cells were treated with 5 nM of siCTRL (-) or siERBB3 (+) for 72 h in A, B and D, for 48 h in C and for 24 h in E, respectively. (A) Viable cells were counted after siRNA treatment in p53−/− (p53-/-) or parental p53+/+ HCT116 cells (p53+/+). (B) Cell cycle distribution was analyzed with FACS after the siRNA treatment in p53+/+ or p53-/- cells. (C) Equal amounts of protein extracts were analyzed with western blotting and the relative intensity of proteins compared to ACTB was normalized to that of siCTRL. Parp1 cleavage was also quantified. (D) Protein extracts in the cytosol or membrane/organelle fraction were analyzed by western blotting in p53-/- cells (left). The relative band intensities of mitochondrial Bax to cytosolic Bax were normalized to those of siCTRL (right). ns., statistically non-significant. (E) The relative amounts of BAK1 mRNA were analyzed by qRT-PCR analysis using purified RNA from wild-type, p53+/+, and p53-/- cells. siERBB3 group was statistically compared to siCTRL group at each point, unless otherwise indicated.