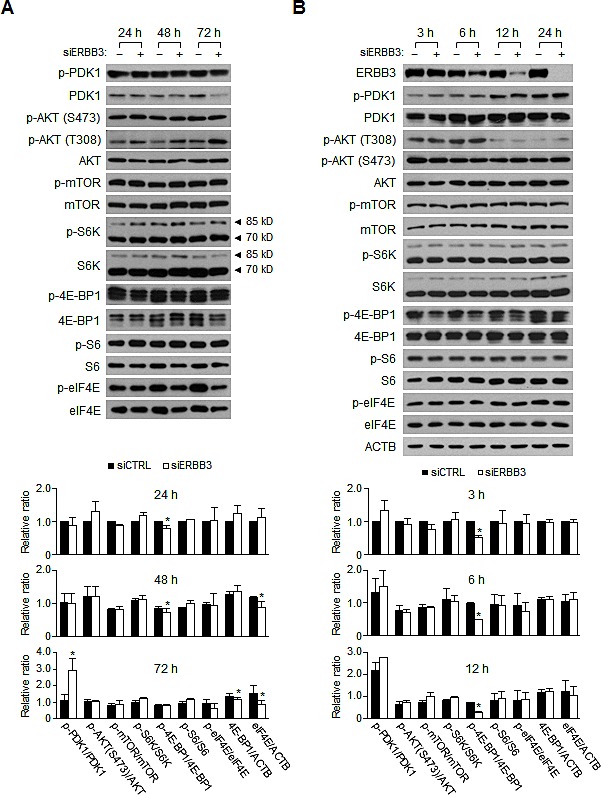
Figure 5. Changes in the signaling pathways induced by ERBB3 knockdowns in HCT116 cells.

(A) Western blotting was performed using the protein extracts prepared (A) daily or (B) at indicated hours after siRNA (5 nM) transfection. siERBB3 group was statistically compared to siCTRL group at each point. The relative intensity of proteins in A, B was normalized to that of siCTRL at 24 h (A, bottom) or that of siCTRL at 3 h (B, bottom). Only statistically significant differences are marked.
