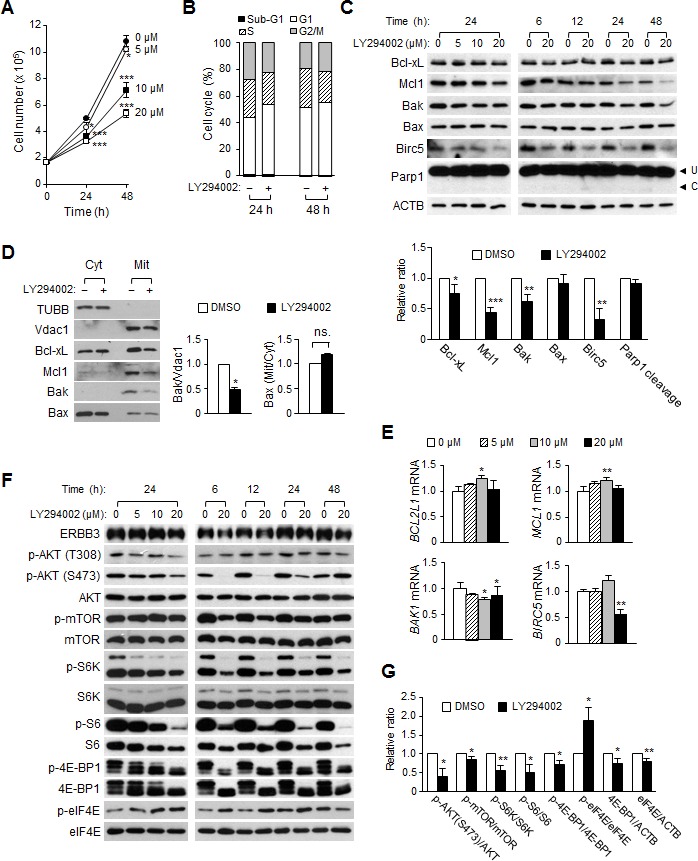
Figure 6. The effect of LY294002 on cell proliferation, cell cycles and apoptosis in HCT116 cells.

(A) Viable cells were counted daily after treatment with a different concentration of LY294002. (B) Cell cycle distribution was analyzed by FACS 24 and 48 h after treatment with 20 μM of LY294002 (+) or DMSO (–), respectively. (C) The amounts of anti- or pro-apoptotic proteins were analyzed by western blotting. Protein extracts were prepared either 24 h after treatment with different concentrations of LY294002 (left) or at different time points after treatment with 20 μM of LY294002 (right). The relative intensity of proteins (24 h with 20 μM of LY294002) compared to ACTB was normalized to that of DMSO-treated group and Parp1 cleavage was also quantified (bottom). (D) Western blotting was performed using cytosol or membrane/organelle fractions that had been prepared 24 h after 20 μM of LY294002 (+) or DMSO (–) treatment. The relative band intensities of the mitochondrial Bak to Vdac1 and of mitochondrial Bax to cytosolic Bax were normalized to that of the DMSO-treated group. (E) The relative amounts of mRNA were analyzed by qRT-PCR analysis using purified RNA from cells 24 h after the LY294002 treatment. (F) Shown are the representative western blots of the PI3K downstream pathway after LY294002 treatment. (G) The relative intensity of proteins (24 h with 20 μM of LY294002) in F was normalized to that of DMSO-treated group.
