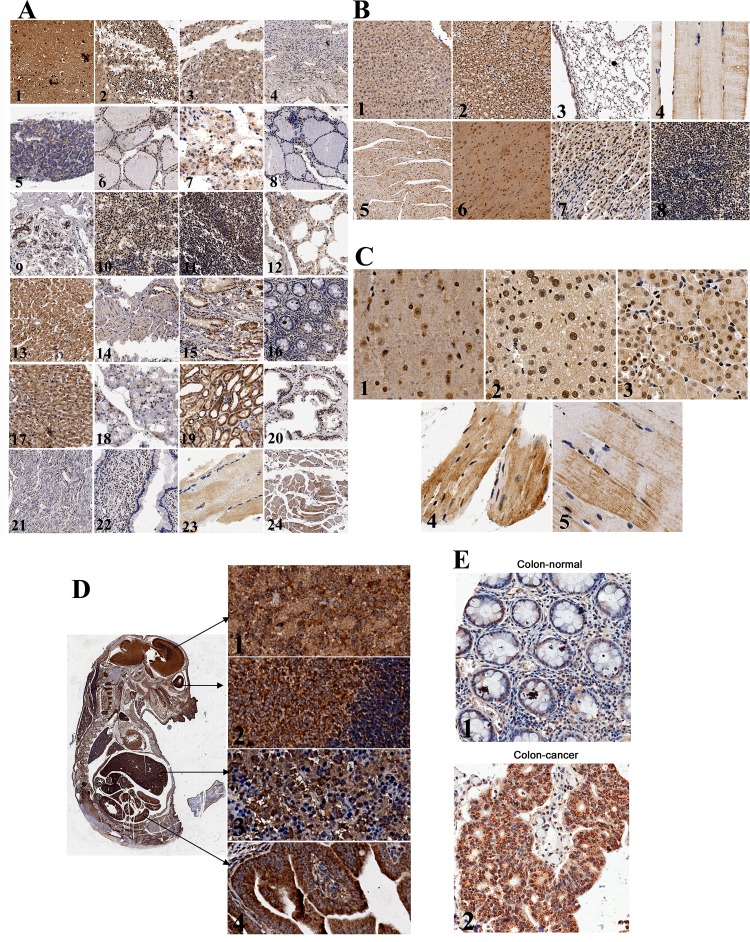
Figure 1. Expression and localization of endogenous MTA1 in tissues detected using immunohistochemistry.
A, Expression of MTA1 in normal adult human tissues: 1. brain, 2. cerebellum, 3. adrenal gland, 4. ovary, 5. pancreas, 6. parathyroid gland, 7. pituitary gland, 8. thyroid, 9. mammary gland, 10.spleen, 11. tonsil, 12. lung, 13. cardiac muscle, 14. esophagus, 15. stomach, 16. colon, 17. liver, 18. salivary gland, 19. kidney, 20. prostate, 21. Endometrium, 22. cervix, 23. skeletal muscle, and 24. throat; B, Expression of MTA1 in normal adult mouse tissues: 1. liver, 2. kidney, 3. lung, 4. skeletal muscle, 5. cardiac muscle, 6. brain, 7. stomach, and 8. spleen; C, Subcellular distribution of MTA1: 1. brain, 2. liver, 3. kidney, 4. cardiac muscle, and 5. skeletal muscle; D, Left, expression of MTA1 in the mouse embryo (day 14); Right, subcellular localization of MTA1 in original tissues: 1. brain, 2. eyes, 3. liver, and 4. intestines; E, Expression and subcellular localization of MTA1 in normal (1) and cancerous (2) colon tissues.

