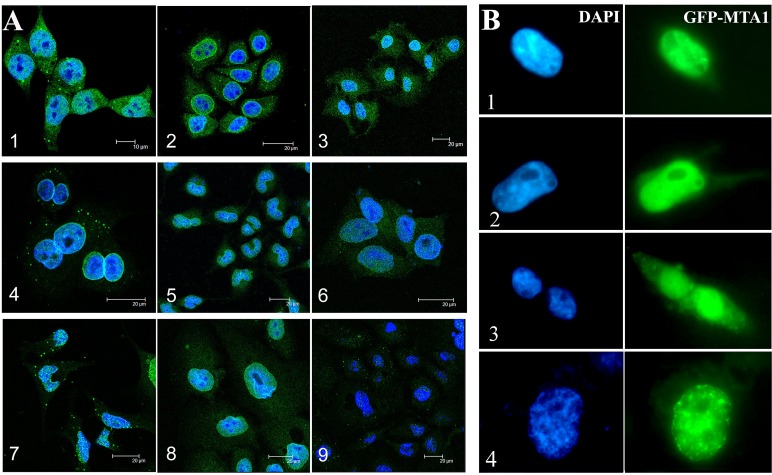
Figure 2. Subcellular localization of MTA1 in cell lines detected through IF.
(A) and GFP-tag tracing (B). A, 1. HCT116, 2. NCI-H446, 3. Ishikawa, 4. SF-767, 5. Hep3B, 6. HCT8, 7. HEK293, 8. HaCaT, and 9. Caski; B, Distributions of GFP-MTA1 expression in HEK293 cells. 1 and 2 show cells with low GFP-MTA1 expression in the cytoplasm, 3. cells with high cytoplasmic GFP-MTA1 expression, 4. a cell with apparent GFP-MTA1 fluorescence on the nuclear envelope.

