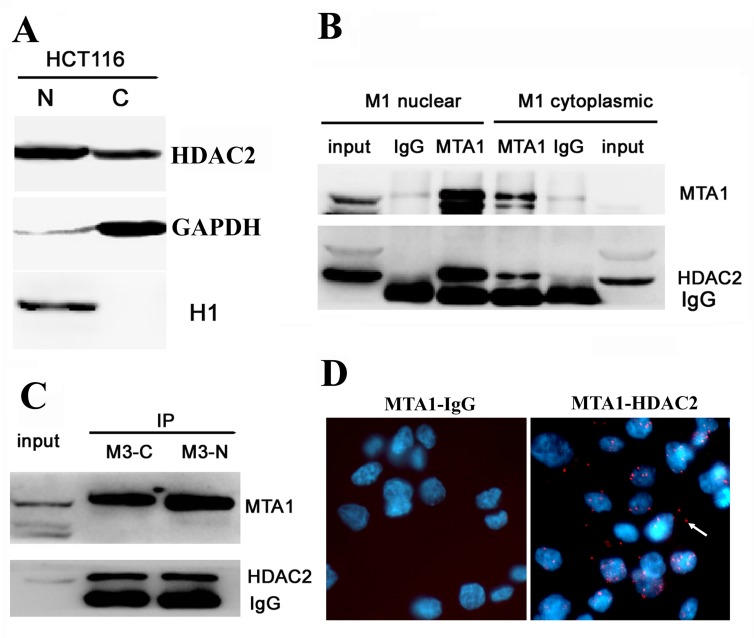
Figure 4. MTA1 interacts with HDAC2 at both the nucleus and cytoplasm.
A, Western blot analysis showing the localization of HDA2 to both the nucleus (N) and cytoplasm (C) of HCT116 cells; B, In vitro immunoprecipitation analysis of the MTA1-HDAC2 interaction in the nuclear and cytoplasmic fractions of HCT116-M1 cells; C, In vitro immunoprecipitation analysis of the MTA1-HDAC2 interaction in the nuclear and cytoplasmic fractions of HCT116-M3 cells; D, In situ PLA analysis. left, the control interaction detected using mouse antibody against MTA1 and rabbit IgG; right, in situ PLA visualization of the MTA1-HDAC2 interaction in both the nucleus and cytoplasm of HCT116 cells. The white arrow shows the positive signal in the cytoplasm.

