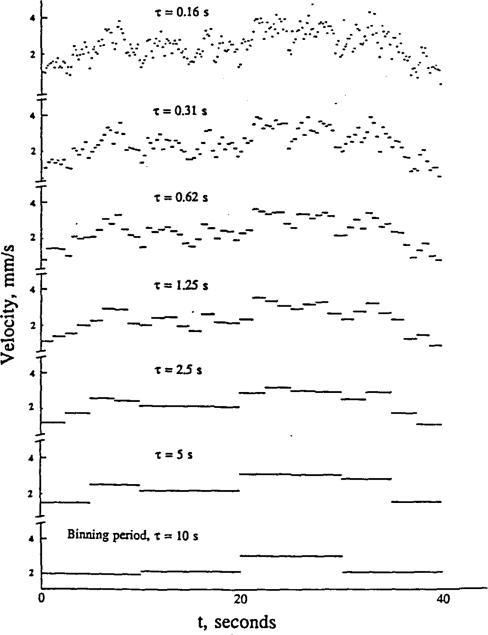
Figure 3.
Diagrammatic representation of data showing temporal fluctuations. The raw “data” of the top panel are then binned over successively longer times τ for the panels below. Lower resolution detection, e.g. a filtered signal or a long time constant in the transduction system, results in underestimation of the excursions. As with the spatial fractals, projection to higher frequencies may be justified.

