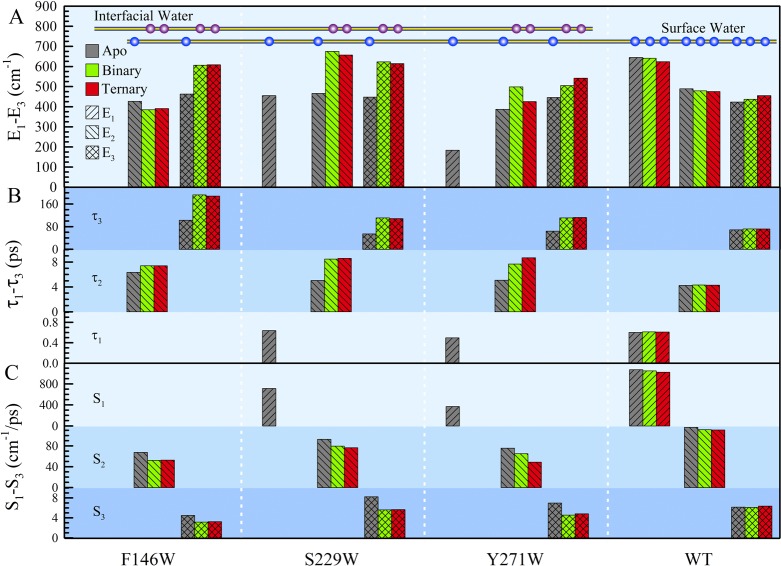
Figure 5.
Detailed analyses of the solvation dynamics of the three mutants and WT in the apo (gray), binary (green), and ternary (red) states. Panels A–C show the relaxation energies, relaxation times, and solvation speeds, respectively. When the DNA and nucleotide bind, the solvation energies are redistributed according to the local water network change (see context). F146W and S229W, located at the DNA binding sites, show significant slowdown in both relaxation times and solvation speeds from the apo to binary states. The relaxation of the active-site mutant Y271W gradually slows down from the apo to complex states. Notice that the ultrafast components completely disappear in the complex states of S229W and Y271W because of the confinement of water at the interface. As a control, the WT keeps similar solvation dynamics in all states.

