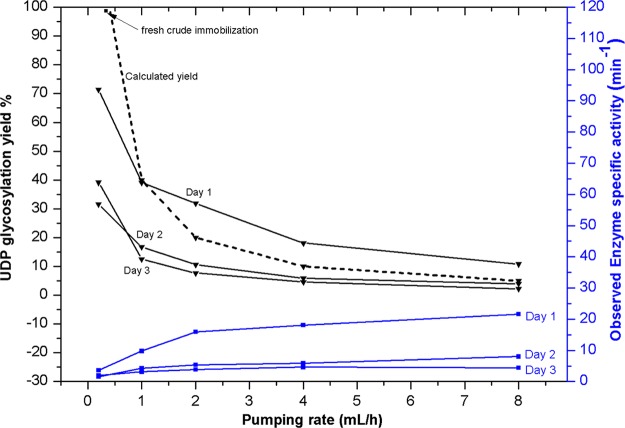
Figure 5.
Calculated (dotted line) and observed UDP-Glc production as a function of flow rate; for a pumping rate of 0.2, 1, and 2 mL/h, the pumping time was 4 h, and for a pumping rate 4 and 8 mL/h, the pumping time was 1 h. Day 1 refers to a complete series of runs at specified pumping rates, followed by repeating a second complete series on day 2 to show enzyme stability. Square marker was for an experiment performed at optimal flow rates with fresh enzyme separated directly from cell crude.

