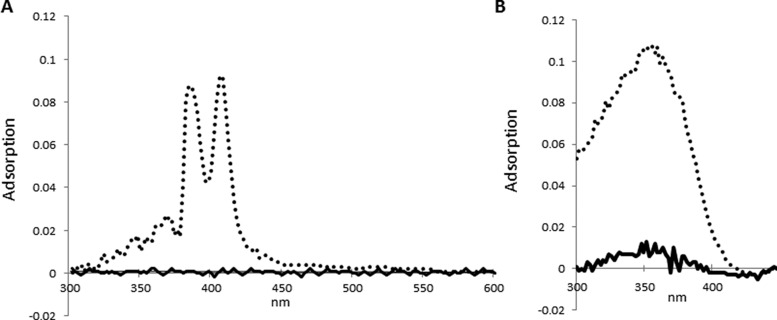
Figure 4.
Spectrophotometric analysis showing the adsorption spectra for AMB (A) and ATRA (B) after incubation with either control (solid line) or AH vaults (dotted line) with subsequent repurification of vaults via ultracentrifugation over a discontinuous sucrose gradient. Spectra represent the 40–45% layer where vaults sediment.

