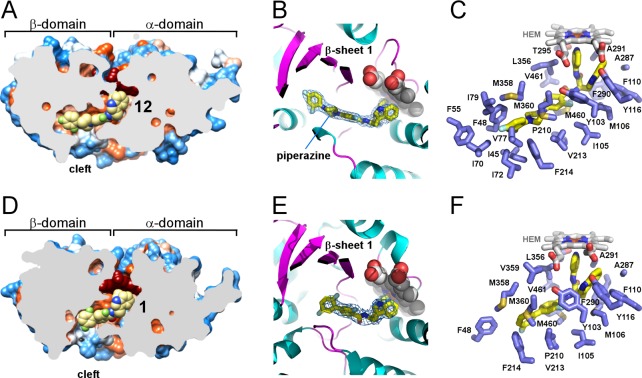
Figure 5.
Inhibitors in the active site of TcCYP51. (A,D) Slice through the binding site shows bound inhibitors (yellow spheres) and the protein surface colored by hydrophobicity, hydrophobic areas are in orange and hydrophilic areas are in blue. Heme is in dark-red spheres. (B) Piperazine group separating two phenyl rings in the 12 (yellow sticks) allows smooth bending of the long substituent along the β-sheet saddle (magenta). A fragment of the electron density map (blue mesh) contoured at 1.2 σ delineates position of 12 at 2.04 Å resolution. Protein is in ribbon, heme is in spheres. (C,F) Residues within 5 Å from the inhibitor (yellow sticks) are highlighted in blue, heme is in gray sticks. (E) Binding mode of 1 resembles that of 12 (B), with fewer contacts for the long substituent at the chiral carbon center. Electron density map at 2.84 Å is contoured at 0.8 σ. Images here and otherwise were generated using CHIMERA83 or PYMOL84

