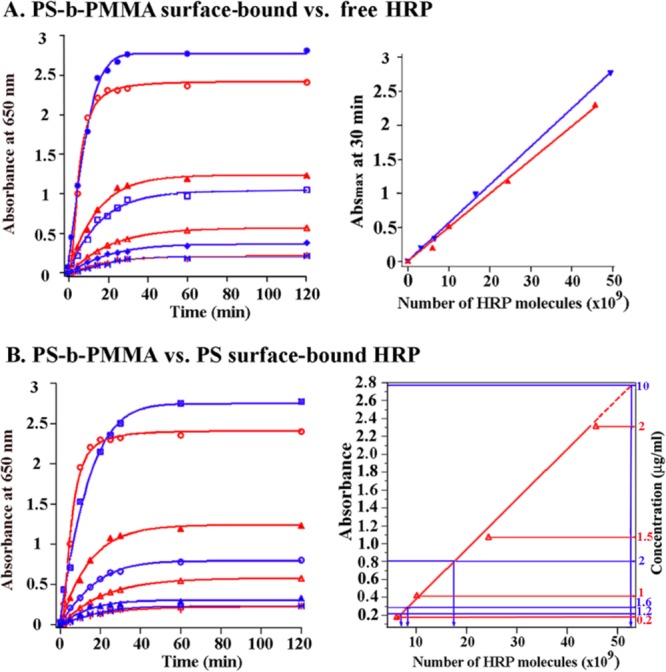
Figure 11.

(A) Differences in HRP activity between their free state and PS-b-PMMA bound state are evaluated on the basis of their UV–vis absorbance at λ = 650 nm. Blue data points represent the activities of HRP molecules freely floating in solution, and red data points represent those of HRP molecules immobilized on PS-b-PMMA surfaces. From top to bottom, plots shown in the left panel correspond to 0.15 (f: free-state), 2 (b: bound-state), 1.5 (b), 0.05 (f), 1 (b), 0.02 (f), 0.1 (b), and 0.01 (f) μg/mL of either the free- or bound-state HRP concentration. These concentration conditions correspond to the total number of HRP molecules of 49.5 × 10⁹, 45.7 × 10⁹, 24.4 × 10⁹, 16.5 × 10⁹, 10.1 × 10⁹, 6.6 × 10⁹, 6.1 × 10⁹, and 3.3 × 10⁹ from top to bottom plots. When the enzymatic activities of the same number of HRP molecules in the free versus bound state are compared in the right panel, PS-b-PMMA-bound HRP retained approximately 85% of its free-state activity. (B) PSD comparison of HRP molecules carried out between PS-b-PMMA (red) vs PS (blue) surfaces. UV–vis absorbance values of PS-b-PMMA-bound and PS-bound HRP recorded at λ = 650 nm are measured with respect to time. When absorbance maxima are compared against the number of HRP molecules on the two types of surfaces, the adsorbed amount of HRP on the chemically heterogeneous diblock surface is much greater than that on the chemically homogeneous PS surface at the same HRP deposition concentration. Reproduced with permission from refs (24) and (26) (copyrights 2007 and 2008 American Chemical Society, respectively).
