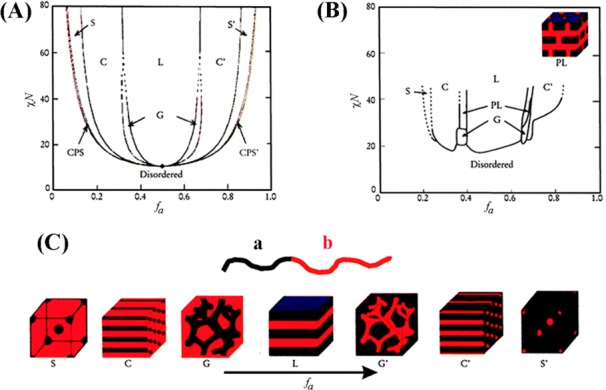
Figure 2.

Phase diagram of a linear a–b block copolymer. (A) The diagram is a theoretical phase prediction based on the self-consistent mean-field theory, and (B) the diagram is the experimental phase portrait of poly(isoprene-styrene) block copolymers. χ, N, and fa refer to the segment–segment interaction parameter, the degree of polymerization, and the composition of the a segment, respectively. (C) Morphologies of CPS, S, C, G, L, and metastable PL shown in the phase diagrams correspond to a close-packed sphere, sphere, cylinder, gyroid, lamellar, and perforated layer, respectively. Images in A and C) and (B) are reproduced with permission from (A, C) ref (35) (copyright 2008 AIP Publishing LLC) and (B) ref (40) (copyright 1995 American Chemical Society).
