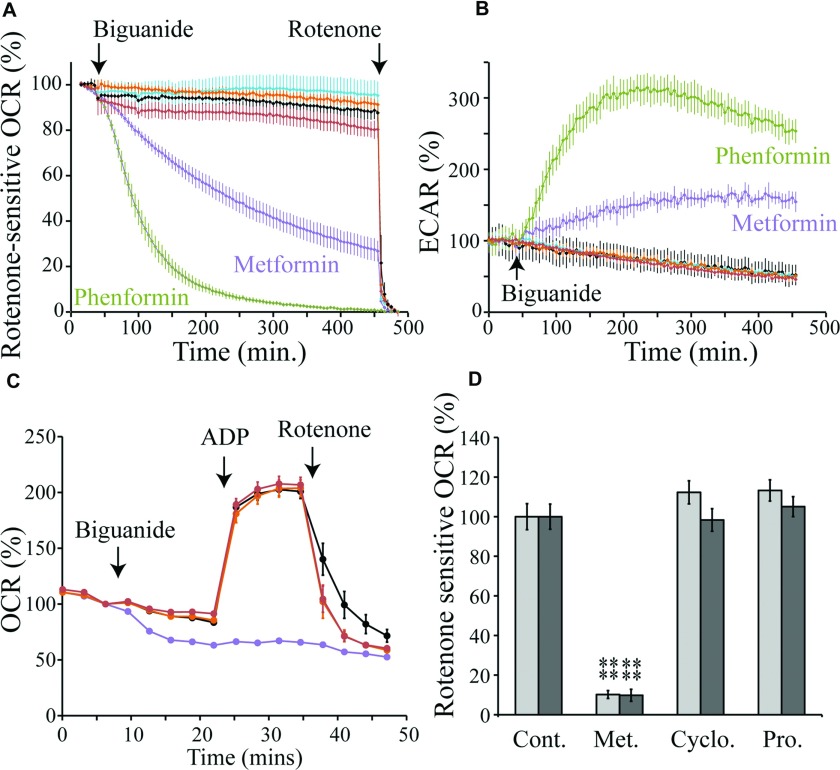
Figure 5. Selective uptake of biguanides into mitochondria.
(A) Effects of biguanides on the rotenone-sensitive OCR of Hep G2 cells. The traces are the means±S.D. of multiple traces. The biguanide concentrations are equal to the complex I IC50/10 values. Purple, 1.9 mM metformin; green, 0.04 mM phenformin; orange, 0.07 mM cycloguanil added in DMSO; red, 0.007 mM proguanil in DMSO; black, control (no biguanide); cyan, control (DMSO). (B) The effects of biguanides on the ECAR of Hep G2 cells. Conditions and colours as in (A). (C) Mitochondrial respiratory coupling test on 143B cells permeabilized with 2 nM PMP, respiring on pyruvate and malate and using biguanides at concentrations equal to their complex I IC50/10 values. Black, control; purple, 2 mM metformin; orange, 0.07 mM cycloguanil; red, 0.007 mM proguanil. Data points are means±S.E.M., n=5–6. (D) Rates of rotenone-sensitive ADP-stimulated NADH-linked respiration in permeabilized 143B cells (light grey) and rat liver mitochondria (dark grey) after 15 min of incubation with 2 mM metformin (Met.), 0.07 mM cycloguanil (Cyclo.) or 0.007 mM proguanil (Pro.). Values are mean percentage of the control±S.E.M., n=5–6. ****P< 0.01. Cont. control.

