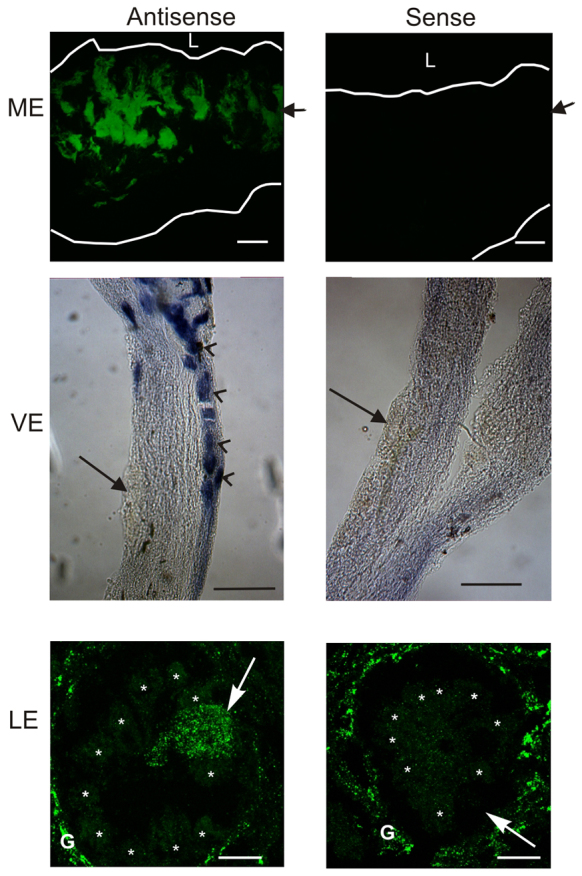
Fig. 4.

In situ hybridizations showing the distribution of LpUVOps1 transcripts in median (ME), ventral (VE) and lateral eyes (LE). For MEs, oblique sections were incubated with sense and antisense probes that were visualized as fluorescein fluorescence using a confocal microscope. Images are maximum projections of 4–5 μm stacks. The tissue is outlined. L, position of the lens; arrows, position of the photoreceptor cell layer. Scale bars, 100 μm. For VEs, whole mounts were incubated with sense and antisense probes that were visualized using the NBT/BCIP reaction and viewed with a dissecting microscope. Small cells (arrowheads) labeled with the antisense but not the sense probe. Giant photoreceptors (arrows) did not label with either probe. Both images are from near the EO. Scale bars, 100 μm. For LEs, cross-sections incubated with antisense and sense probes were analyzed as described in A. Images are maximum projections of 13–15 μm stacks of images through individual ommatidia. The locations of retinular cell bodies (asterisks), eccentric cell bodies (arrows) and glia (G) are indicated. The antisense probe labeled eccentric cell bodies and glia surrounding ommatidia and but not retinular cells. The sense probe also labeled gial but did not label eccentric cell bodies. Scale bars, 50 μm.
