Fig. 2.
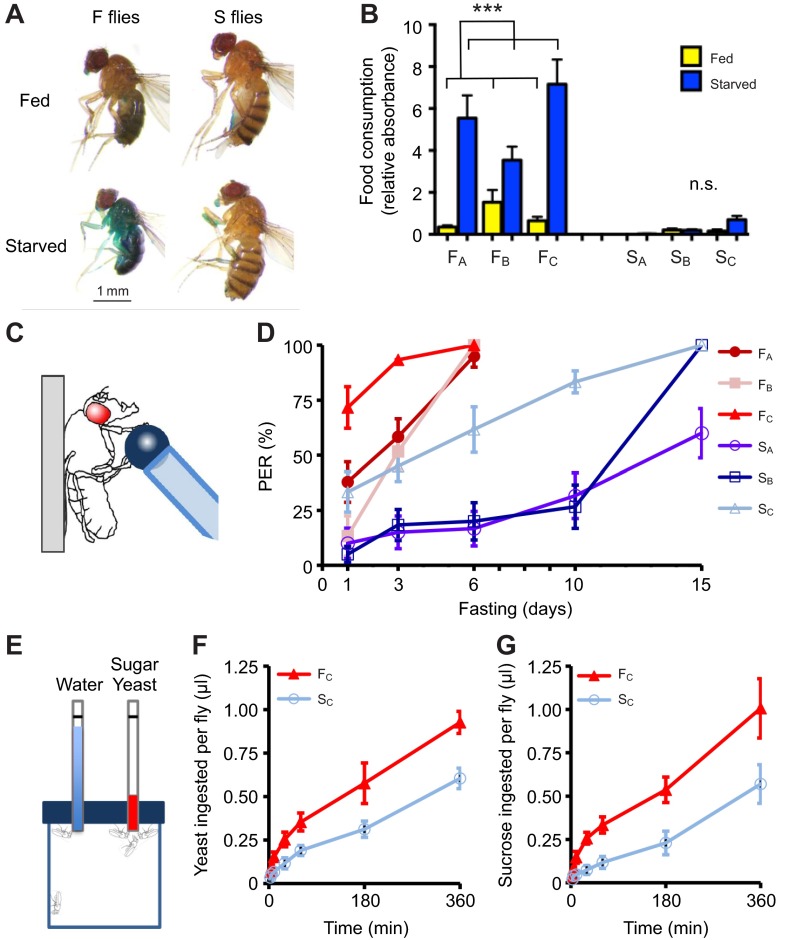
Fasting-induced feeding is reduced in S populations. (A) Elevated levels of a blue dye are clearly more abundant in the abdomen of 48 h fasted F flies compared with fed controls. Blue dye was not visible in fasted or fed S populations. (B) Spectroscopy based quantification of blue-dye levels revealed a significant increase of food consumption in fasted flies (two-way ANOVA: F1,180=44.2, P<0.001, N=92 and 92, fed and starved conditions, respectively) and increase in F populations (F1,180=48.1, P<0.001, N=88 and 96, F and S populations, respectively). In addition, there is a significant interaction between food consumption and population (F1,180=35.4, P<0.001), indicating different responses to the starvation between S and F populations. The post hoc test revealed the fasted F population increased food consumption (t55.2=−6.1, P<0.001, N=44 for fed and starved condition), whereas no difference was found for the S population (t76.3=−1.9, P=0.066, N=48 for fed and starved conditions). (C) Reflexive feeding was measured by providing flies with sucrose and measuring the PER. (D) The slope of the grouped F populations were significantly steeper than those of the grouped S population [ANCOVA (group×day interaction): F1,474=56.9, P<0.001, N=60 for F and S groups], suggesting that PER was significantly higher in equally fasted F flies compared with S populations. (E) Long-term consumption of 150 mmol l−1 sucrose and 5% yeast was measured in the CAFÉ assay. (F) The C group F flies consumed significantly more yeast within 10 min and more sucrose within 30 min than C group S flies (P<0.039 and P<0.013, respectively). n.s., not significant, ***P<0.001.

