
Fig. 4.
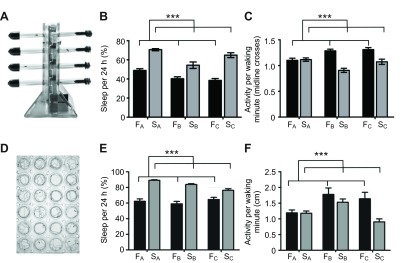
Sleep is dramatically increased in flies selected for starvation resistance. (A) Activity was monitored by measuring the number of infrared-beam crossings in the DAM system. (B) Total sleep duration (percentage of 24 h) was measured for day 1 on food and subsequent days on agar. S flies slept more than F flies on food (F1,305=141.3, P<0.001, N=190 and 121 for control F and S populations, respectively). (C) The A populations of S and F flies did not differ in their waking activity (t122=-0.27, P=0.789), whereas S flies in the B and C groups were less active than F flies, and overall waking activity was reduced in S population flies (F1,305=30.1, P<0.001, N=190 and 121 for F and S populations, respectively) when measured using the DAM system. (D) To more precisely quantify sleep, activity was recorded in a custom-built fly-tracking chamber. (E) Video tracking confirmed increased sleep duration in S group flies compared with F control flies (F1,140=116.3, P<0.001 for all groups, N=75 and 71 for F and S populations). (F) Waking activity did not differ between the A and B groups of S flies compared with F flies when video analysis was used (post hoc test for group A and B: t41=0.1 and t28.1=1.1, respectively, both P>0.05); however, S flies as a whole were less active than F population flies (F1,121=8.6, P=0.004, N=62 and 65 for F and S populations, respectively). ***P<0.001.