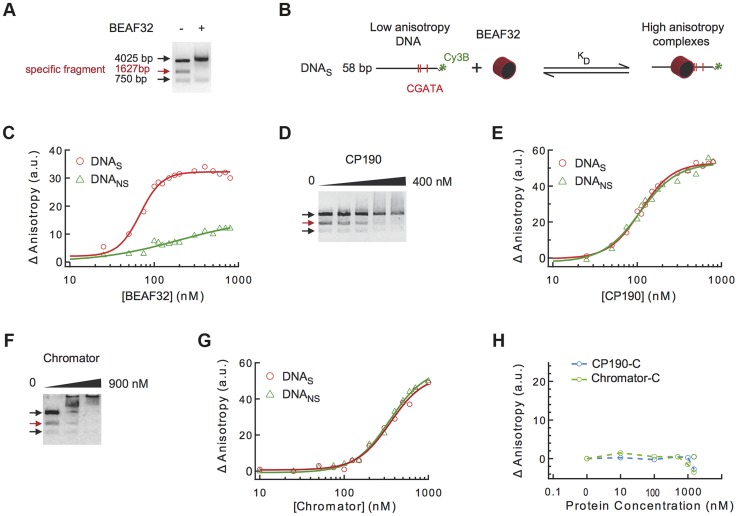
Figure 2. Binding of insulator factors to DNA.
(A) Electric mobility shift assay (EMSA) of BEAF32-DNAtudor complexes. A plasmid containing DNAtudor was digested resulting in three linear fragments of size 750, 4025 and 1627 bp (the fragment containing DNAtudor, red). Addition of BEAF32 (200 nM) leads to the preferential disappearance of the band containing CGATA motifs. (B) Scheme representing the experimental setup for fluorescence anisotropy measurements of BEAF32-DNA binding equilibrium. Binding of BEAF32 to DNAS (short DNA fragment containing three CGATA motifs) leads to an increase in the size of the complex that can be detected by an increase in the fluorescence anisotropy signal. KD represents the apparent equilibrium dissociation constant of the complex. (C) BEAF32 binding isotherms for DNAS (red circles) and DNANS (DNA fragment of the same size as DNAS but with no CGATA motif, green triangles). Solid lines represent fits to a single-site binding (green) or a Hill model (red). (D) EMSA of CP190-DNAtudor complexes show no specificity of DNA binding for CP190 at this genomic locus. In contrast to BEAF32, CP190 shifted the three DNA fragments with similar efficiency even at high protein concentrations (400 nM). Concentrations used were: 0, 100, 200, 300 and 400 nM, respectively. The decrease in the intensity of the top band is less pronounced due to intensity saturation. (E) CP190 binding isotherms for DNAS (red circles) and DNANS (green triangles). Solid lines represent fits to a Hill model. CP190 binds both fragments with no specificity and equal affinity. (F) EMSA of Chromator-DNAtudor complexes show no specific binding for Chromator at this genomic locus. Concentrations used were: 0, 450, and 900 nM, respectively. The intensity of all bands is decreased to the same extent by the binding of Chromator, reflecting non-specific binding to these DNA fragments. (G) Chromator binding isotherms for DNAS (red circles) and DNANS (green triangles). Solid lines represent fits to a Hill model. Consistent with (F), Chromator binds both fragments with no specificity. (H) CP190-C (light blue) and Chromator-C (green) binding isotherms for DNAS. Addition of large protein concentration does not lead to detectable changes in fluorescence anisotropy.

