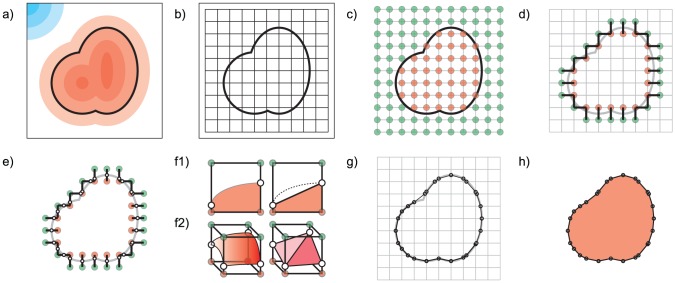
Figure 2. Generating a solid representation of an electrostatic isopotential using marching cubes.
a) The input electrostatic field, illustrated as a gradient of red (negative potential) and blue (positive potential) regions. The solid region to be approximated is within the heavy black line. b) Axis aligned cubic lattice surrounding solid isopotential (black grid). c) Lattice points (circles) evaluated as being inside (red) or outside (green) the isopotential. d) Selected edges, found between interior and exterior lattice points (short black lines), intersect the electrostatic isopotential (grey curved line). e) Intersection points along each selected edge (small white circles). f1) A two dimensional illustration of the solid isopotential passing through a lattice square (red, left), with interior lattice points shown with red circles, and exterior lattice points shown with green circles. An approximation of the solid isopotential using a straight line is shown on the right. f2) A three dimensional illustration of the surface of a solid isopotential (red gradient, left) inside a lattice cube. Lattice points inside the solid isopotential are shown as red circles, lattice points outside are shown in green. An approximation of the solid isopotential triangles connecting intersection points (white circles) is shown on the right. g) Together, the triangles in all cubes (black lines) form the boundary surface approximating the solid isopotential (h).

