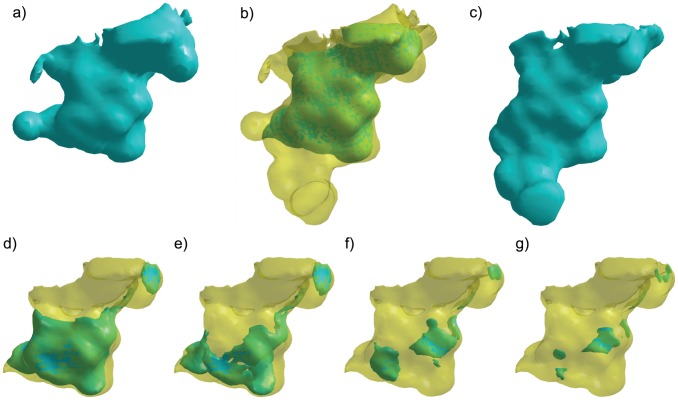
Figure 7. A visual examination of the nullification of aspartate 189 of trypsin.
a) S1 cavity of atlantic salmon trypsin (pdb: 1a0j) shown in teal. b) Intersection region (teal) of S1 cavities from trypsin and chymotrypsin (transparent yellow). c) S1 cavity of bovine chymotrypsin (pdb: 8gch) shown in teal. Inset figs. d-g illustrate cavity fields, all with potential less than −10 kT/e (teal), inside the intersection region (transparent yellow). d) The wild type trypsin cavity field occupies 152 Å3. e) The trypsin cavity field with D189 nullified (32 Å3). f) The wild type chymotrypsin cavity field (9 Å3). g) The chymotrypsin cavity field with D189 nullified (2 Å3).

