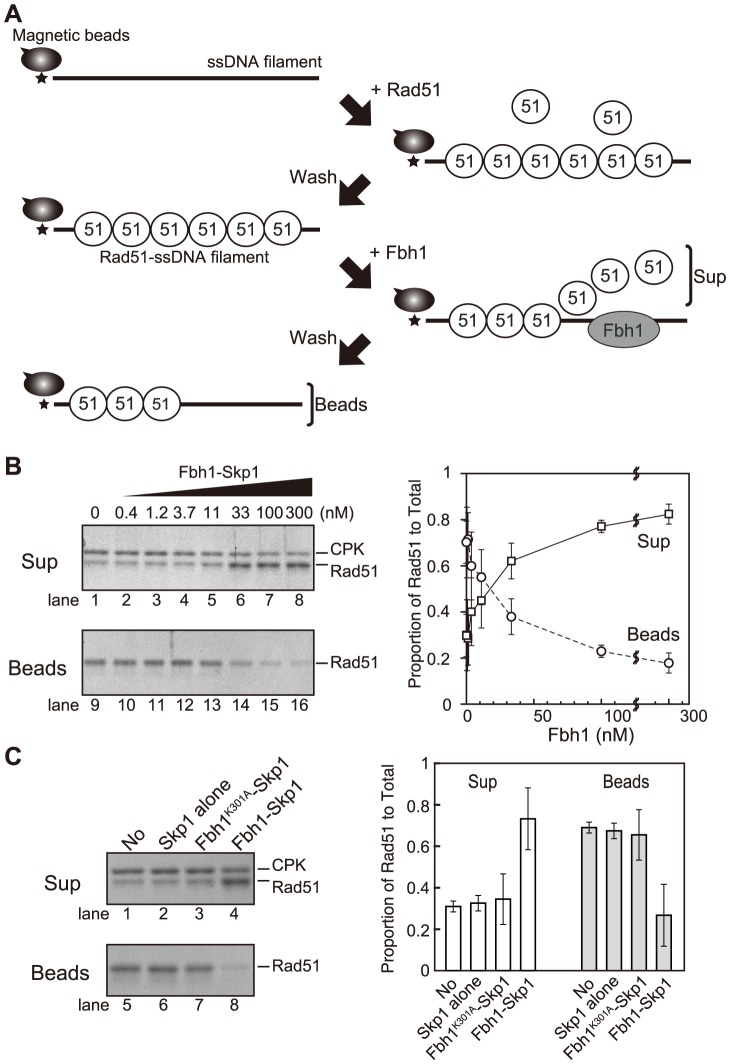
Figure 1. Disruption of Rad51-ssDNA filaments is dependent on Fbh1 helicase/translocase activity.
(A) Schematic diagram of the ssDNA-bead assay. After preparation of ssDNA beads, Rad51 is incubated to form Rad51-ssDNA filaments. After washing, Rad51-ssDNA filament was challenged with the Fbh1-Skp1 complex. After incubation, the supernatant (unbound) and bead (bound) fractions were analyzed by SDS-PAGE and visualized by CBB-G250 staining. (B) The effect of Fbh1-Skp1 dose on stability of the Rad51-ssDNA filament. Left, gel image of the assay; right, quantification of Fbh1-Skp1 dose effects. Images were captured, and the intensities of Rad51 protein bands were quantified. Summary of quantification is presented in the graph at right. The SDS-PAGE gel in the upper image was 9% (19∶1 acrylamide∶bisacrylamide); this condition was used to achieve better separation of CPK and Rad51 bands. The gel in the lower image was 9% (29∶1 acrylamide∶bisacrylamide). Each mean value and standard error (SE) was obtained from three independent experiments. (C) Fbh1, but not Skp1, displaces Rad51 from ssDNA. The ssDNA-bead assay was carried out using wild-type Fbh1, the Walker A mutant of Fbh1 (Fbh1K301A), or Skp1 alone. Left, gel image of the assay. The two SDS-PAGE gels were 9% (19∶1 acrylamide∶bisacrylamide). Right, proportion of Rad51 recovered in the indicated fraction, relative to total amount of Rad51; each mean value and SE was obtained from three independent experiments.

