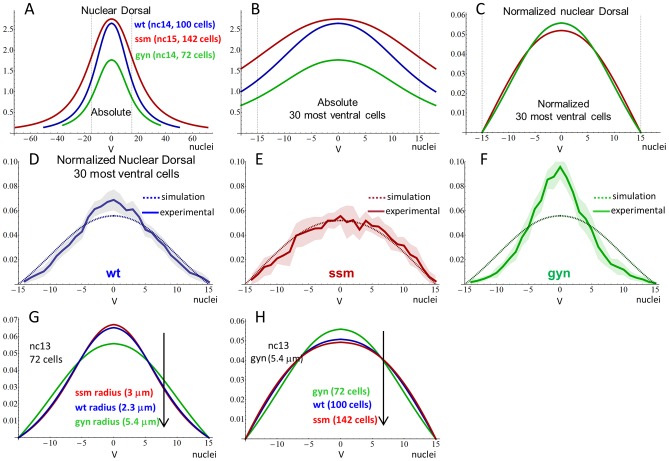
Figure 3. Comparison between experimental data and model output.
A) Simulations of nuclear Dl levels at the last nuclear cycle of each genotype for the entire cross-section. Note that the cross-section has the same size in all genotypes, but the number of nuclei changes, due to extra or fewer nuclear cycles. B) Non-normalized and (C) normalized simulated gradients considering the 30 most ventral cells only. D–F) Direct comparison between experimental data and the model normalized output. Experimental data indicated by solid lines was reproduced from [8]. Shaded areas represent average±SD. G–H) Individual effects of changing nuclei radius and density on the Dl gradient at nuclear cycle 13. G) Increasing nuclei radius and (H) density flattens the gradient, as indicated by arrows. V indicates ventral midline, y axis indicate absolute (A, B) and normalized Dl levels (C–H), x axis indicate nuclei.

