
Figure 4. Changes in kDeg allow the reproduction of the Dl gradient in embryos derived from dl−/dl+ mothers.
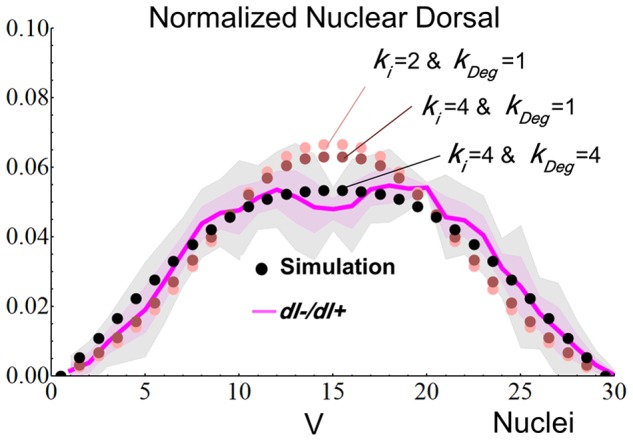
Solid line and pink shadow, experimental quantification of Dl nuclear levels in the 30 most ventral nuclei (mean±SD, n = 5). Dotted lines indicate simulations with original values (light pink dots) for Dl nuclear import rates (ki) and Cact degradation (kDeg), and adjusted values (dark pink and black dots). The other parameters values used in the simulations are shown in the third column of Table 1. Gray shadow is a larger confidence interval (99%) due to the small sample size, and indicates that the slight deepening in the experimental gradient peak is not significant. V indicates ventral midline, y axis indicate normalized Dl levels, x axis indicate nuclei. See Table S5 for fit calculations.