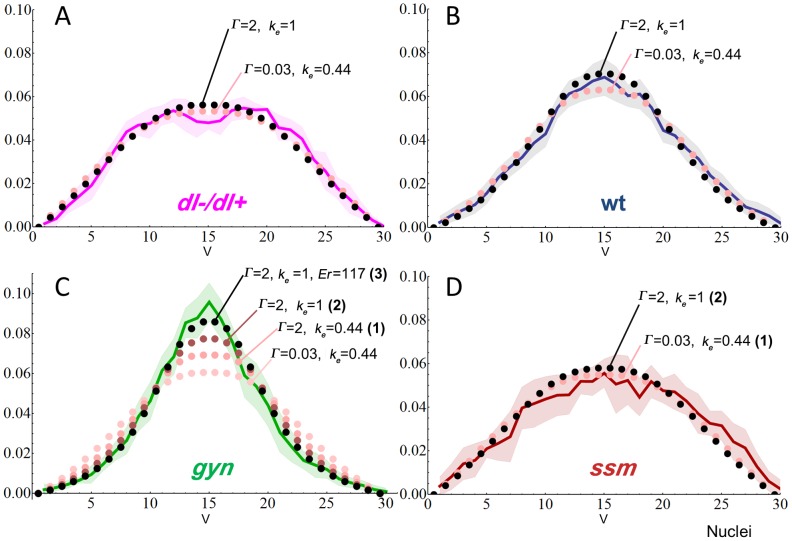
Figure 5. Simulations of wild type and mutant gradients suggest increased diffusion and Dl export rates.
A–D) Comparison between experimental data (solid lines) and simulations (dotted lines) using parameter sets shown in Table 1. Simulations gyn 1–3 and ssm 1–2 from table are indicated by the number in parenthesis in (C) and (D), respectively. V indicates ventral midline, y axis indicate normalized Dl levels, x axis indicate nuclei. See Table S5 for fit calculations. Shaded areas represent average±SD.

