
Figure 7. Simulations of Dl gradient in an additional pair of closely related species with varying egg size suggest a shared Dl-Cact binding rates or Cact degradation rates.
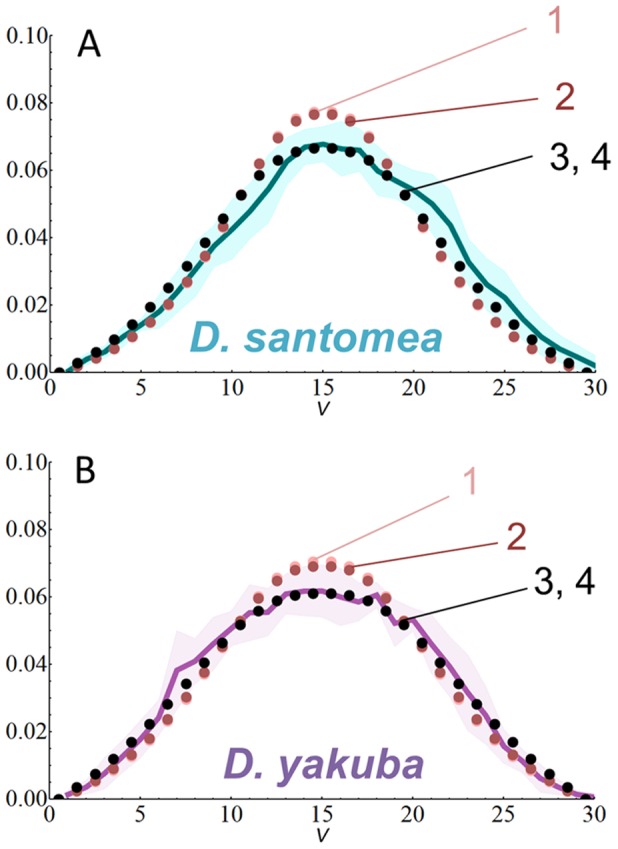
Experimental quantifications (solid lines) and simulations (dotted lines) in D. santomea (A) and D. yakuba (B) based on parameters indicated in Table 3. Shadowed area indicates average±SD. Best fitting curves are obtained with the same lowered kb or the same increased kDeg value for both species (black dots, simulation 3 and 4 respectively). V indicates ventral midline, y axis indicate normalized Dl levels, x axis indicate nuclei. See Table S5 for fit calculations.