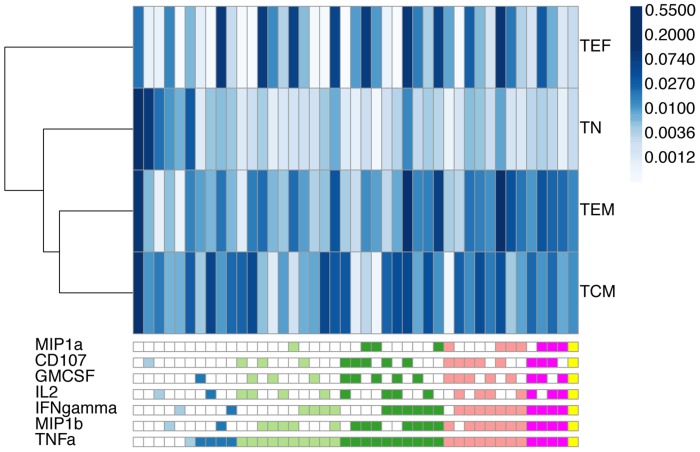
Figure 5. The average frequency of expression across two CyTOF samples for cytokine-producing cell subsets from four T-cell maturational states.
Samples were stimulated with PMA-Ionomycin for 3 hours. Rows represent different maturational cell subsets (TN: naïve, TCM: central memory, TEF: effector, TEM: effector memory) and are clustered by Euclidean distance similarity. Columns represent different cytokine-producing cell subsets. The bottom legend defines the cell subset in a column. The legend is colored by degree of functionality of the cell subsets (light blue: degree 1, dark blue: degree 2, light green: degree 3, dark green: degree 4, salmon: degree 5, red: degree 6, orange: degree 7). The shading of individual blocks of the heatmap represents the average proportion of cells in the subset across the two samples, normalized to the total number of CD8 T-cells. Naïve cells have low polyfunctionality compared to effector, effector memory, and central memory cells.

