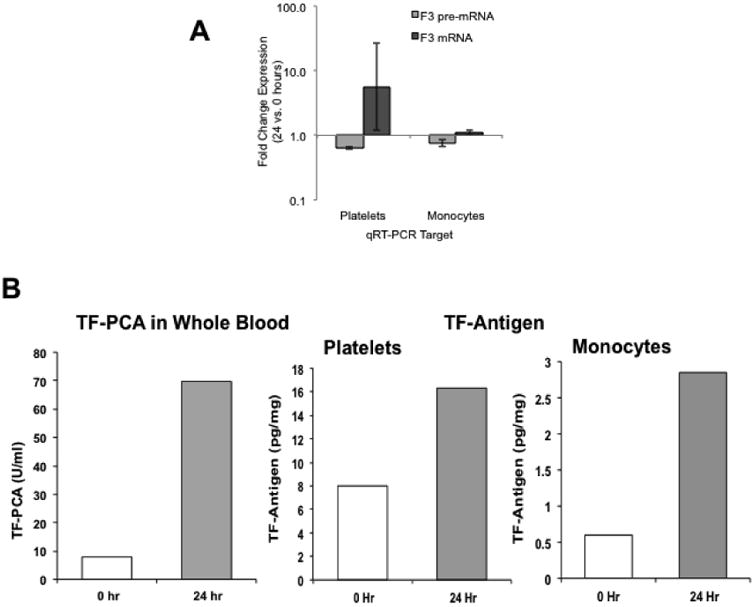
Fig 2.

Top Panel (A): Change (24 versus 0 hours) in tissue factor (F3) pre-mRNA and F3 mRNA expression in platelets and monocytes. Shown are fold change from 0 hours.
Bottom Panel (B): Whole blood tissue factor procoagulant activity (TF-PCA), and tissue factor antigen in platelets and monocytes at 0 and 24 hours of hyperglycemia-hyperinsulinemia.
