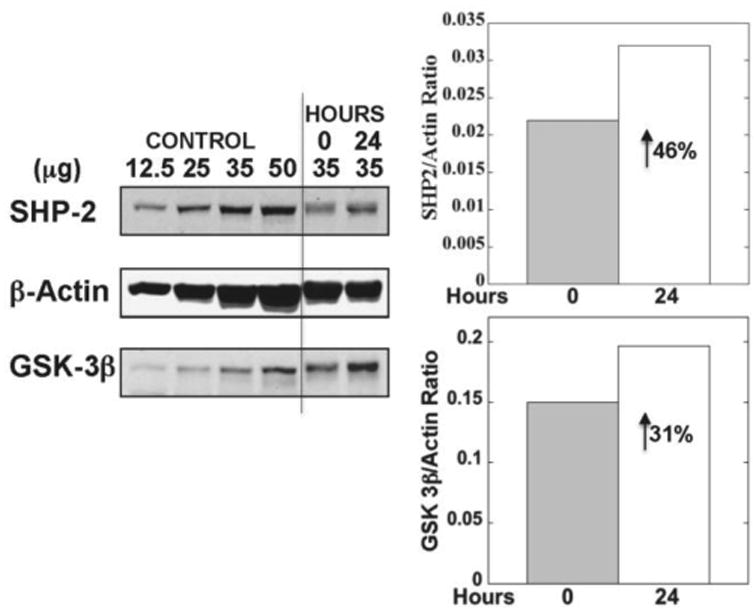
Fig 3.

Changes in platelet protein tyrosine phosphatase (SHP2, PTPN11) and GSK-3B (GSK3B) at 0 and 24 hours. Shown in immunoblots are four dilutions of a control platelet sample and the study subject samples from 0 and 24 hours. The numbers above the lanes show the amount of protein loaded on the gel. Also shown is actin as loading control. The bars on the right show the protein levels at 0 and 24 hours normalized against actin.
