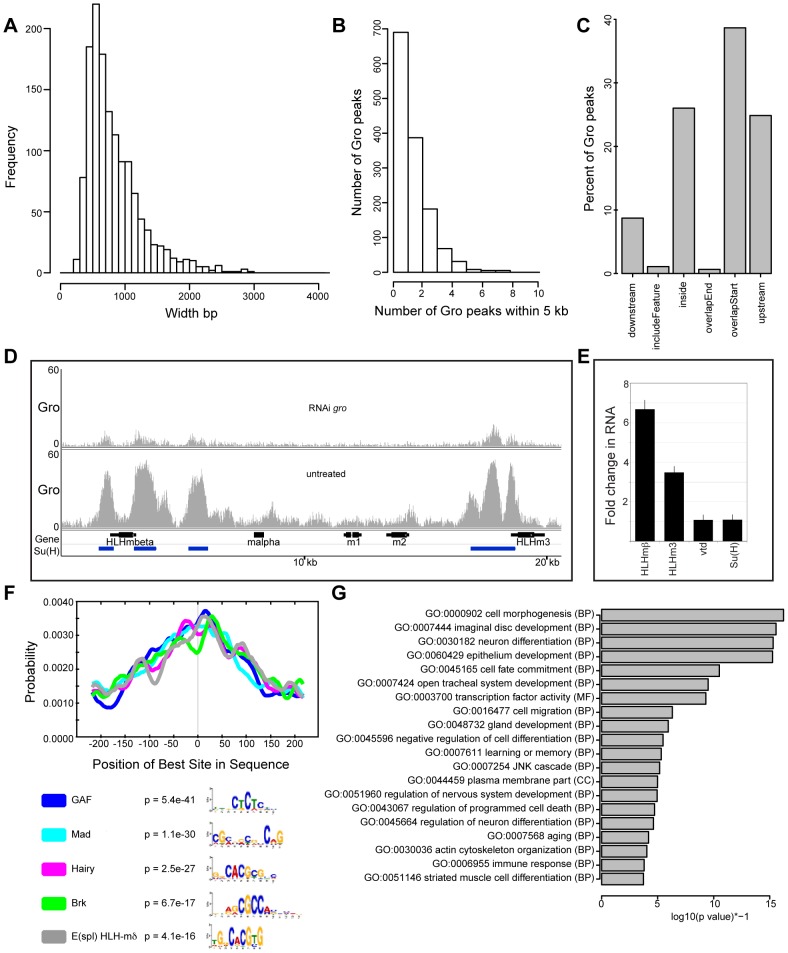
Figure 2. Characterization of high confidence Gro binding sites in Kc167 cells.
A) Histogram showing the frequency of peak widths (100 bp bins) of high confidence Gro binding sites in Kc167 cells. B) Histogram showing the number of peaks observed within 5 kb of another Gro peak. C) Plot showing the position of Gro recruitment in Kc167 cells with respect to annotated transcripts. Note: ‘includeFeature’ means the Gro peak covers the entire transcript and ‘inside’ means the peak is within the transcript boundary. D) Pattern of Gro recruitment in the E(spl)-C in wild-type and Kc167 cells depleted of Gro by RNAi. Peaks of Su(H) binding from ChIP-chip analysis (FDR ≤1 from [28]) are marked as blue bars under the gene names. E) Plot showing up regulation of E(spl)mβ-HLH and E(spl)m3-HLH expression in Kc167 cells treated with gro RNAi detected by quantitative PCR. vtd and Su(H) were included as controls. Jinghua Li and Sarah Bray contributed the data for this panel. F) Centrimo analysis of Gro motif binding in Kc167 cells (Bailey and Machanick, 2012). G) Gene Ontology Analysis of genes associated with Gro peaks. Terms were selected by taking the most significant term (p value<10−4) in a cluster and the most significant unclustered terms generated from an analysis with DAVID [67].

