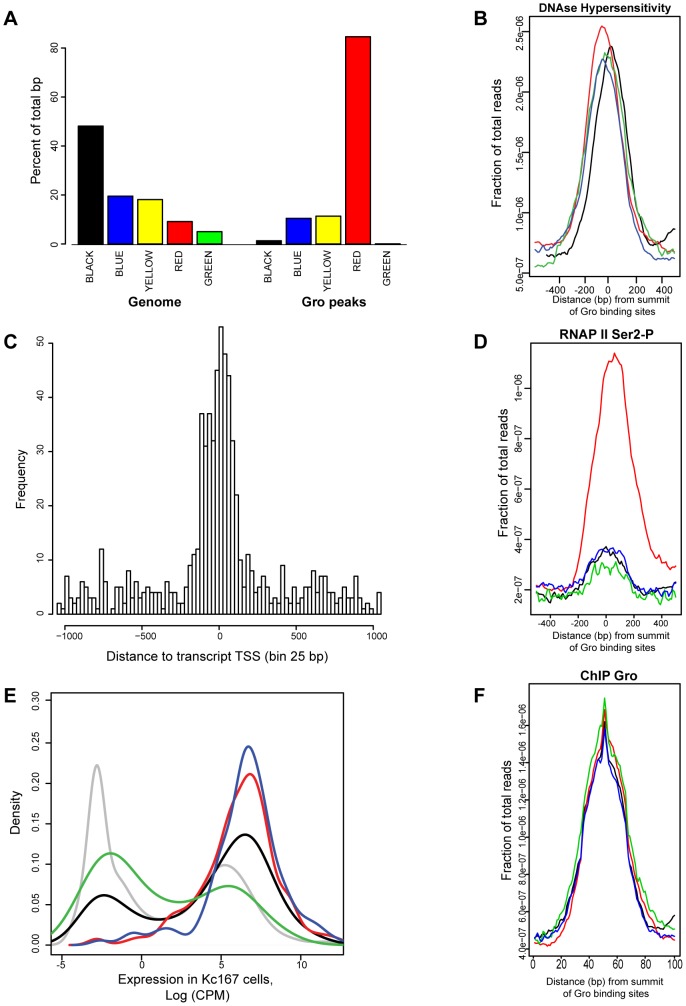
Figure 6. Analysis of the relationship between Gro, chromatin class and RNAP II recruitment in Kc167 cells.
A) Enrichment of Gro peaks in the different classes of chromatin defined by [23]. The class of chromatin is indicated by the colour of the bar and in text underneath. The plot is based on the percentage of Gro binding sites (100 bp near the summit of each peak) within each chromatin class. The plot also includes the per cent of the genome based on the number of base pairs that can be mapped to each chromatin class. B) Average profile of DNase hypersensitive sites with respect to the location of Gro peaks in Kc167 cells. The data for DNase hypersensitive sites was obtained from modENCODE [24]. Location of Gro sites is indicated by red - TSS, black - upstream of a gene, blue - inside a gene, green - downstream of a gene; the profiles are arranged by the strand of the nearest transcript). C) Histogram showing where Gro is binding relative to annotated transcript TSSs. The distance is from the summit of the Gro peak to the nearest TSS, adjusted for strand used for transcription. D) Average profile of RNAP II (Ser2-P form) binding at Gro peaks at different locations. E) Density plot showing expression levels of genes with respect to the site of Gro recruitment. red - TSS, black - upstream of a gene, blue - inside a gene, green - downstream of a gene. The expression level of all annotated genes is shown in grey. F) Plot of the average amount of Gro binding at different locations with respect to genes (location of Gro sites is indicated by red - TSS, black - upstream of a gene, blue - inside a gene, green - downstream of a gene).

